Service Telemetry #
In the service governance module, we can see a variety of telemetry indicators of the service, including
- Logs&events: service log, gateway log, circuit breaker event, current limit event, service online and offline, resource warning
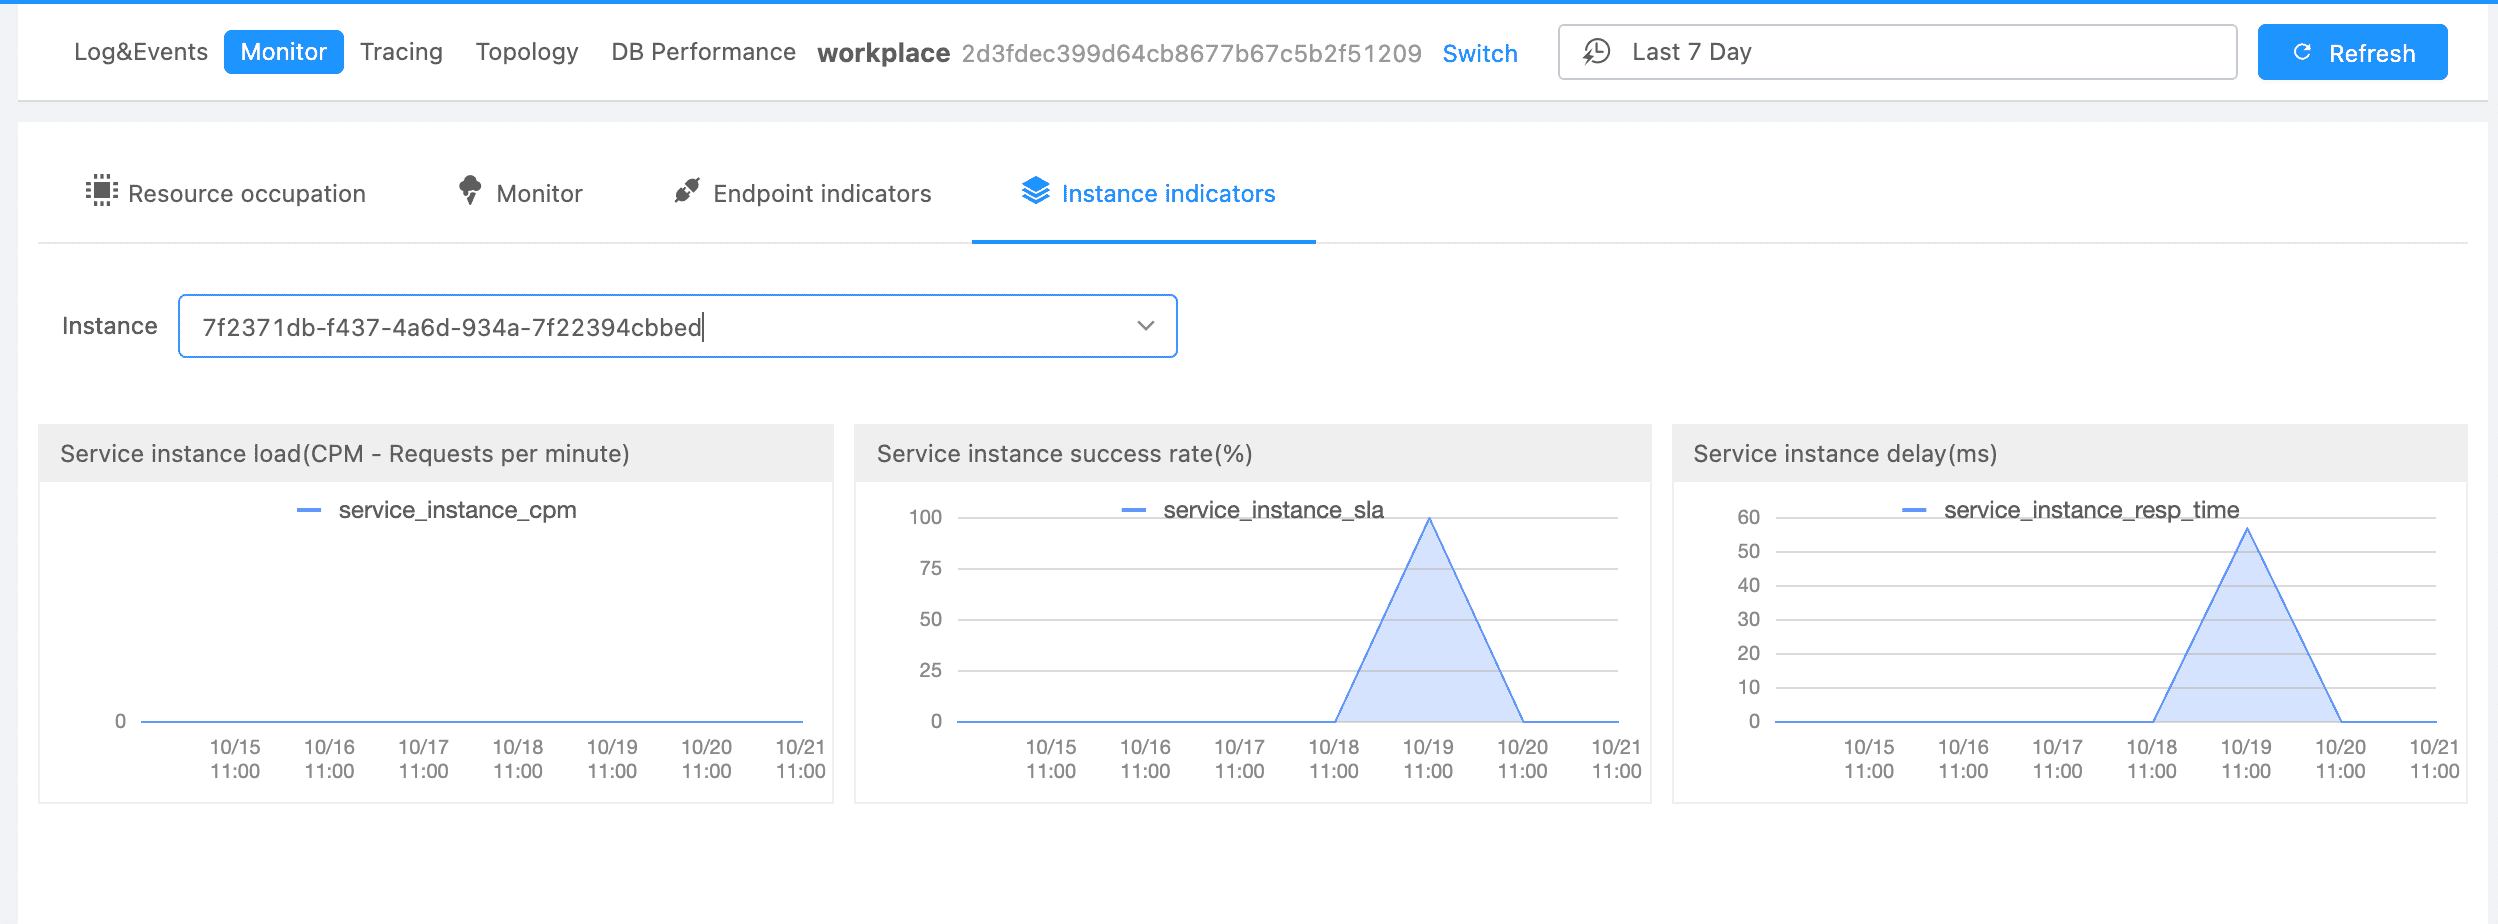
- Service Metrics: resource occupation, service indicators, endpoint indicators, instance indicators
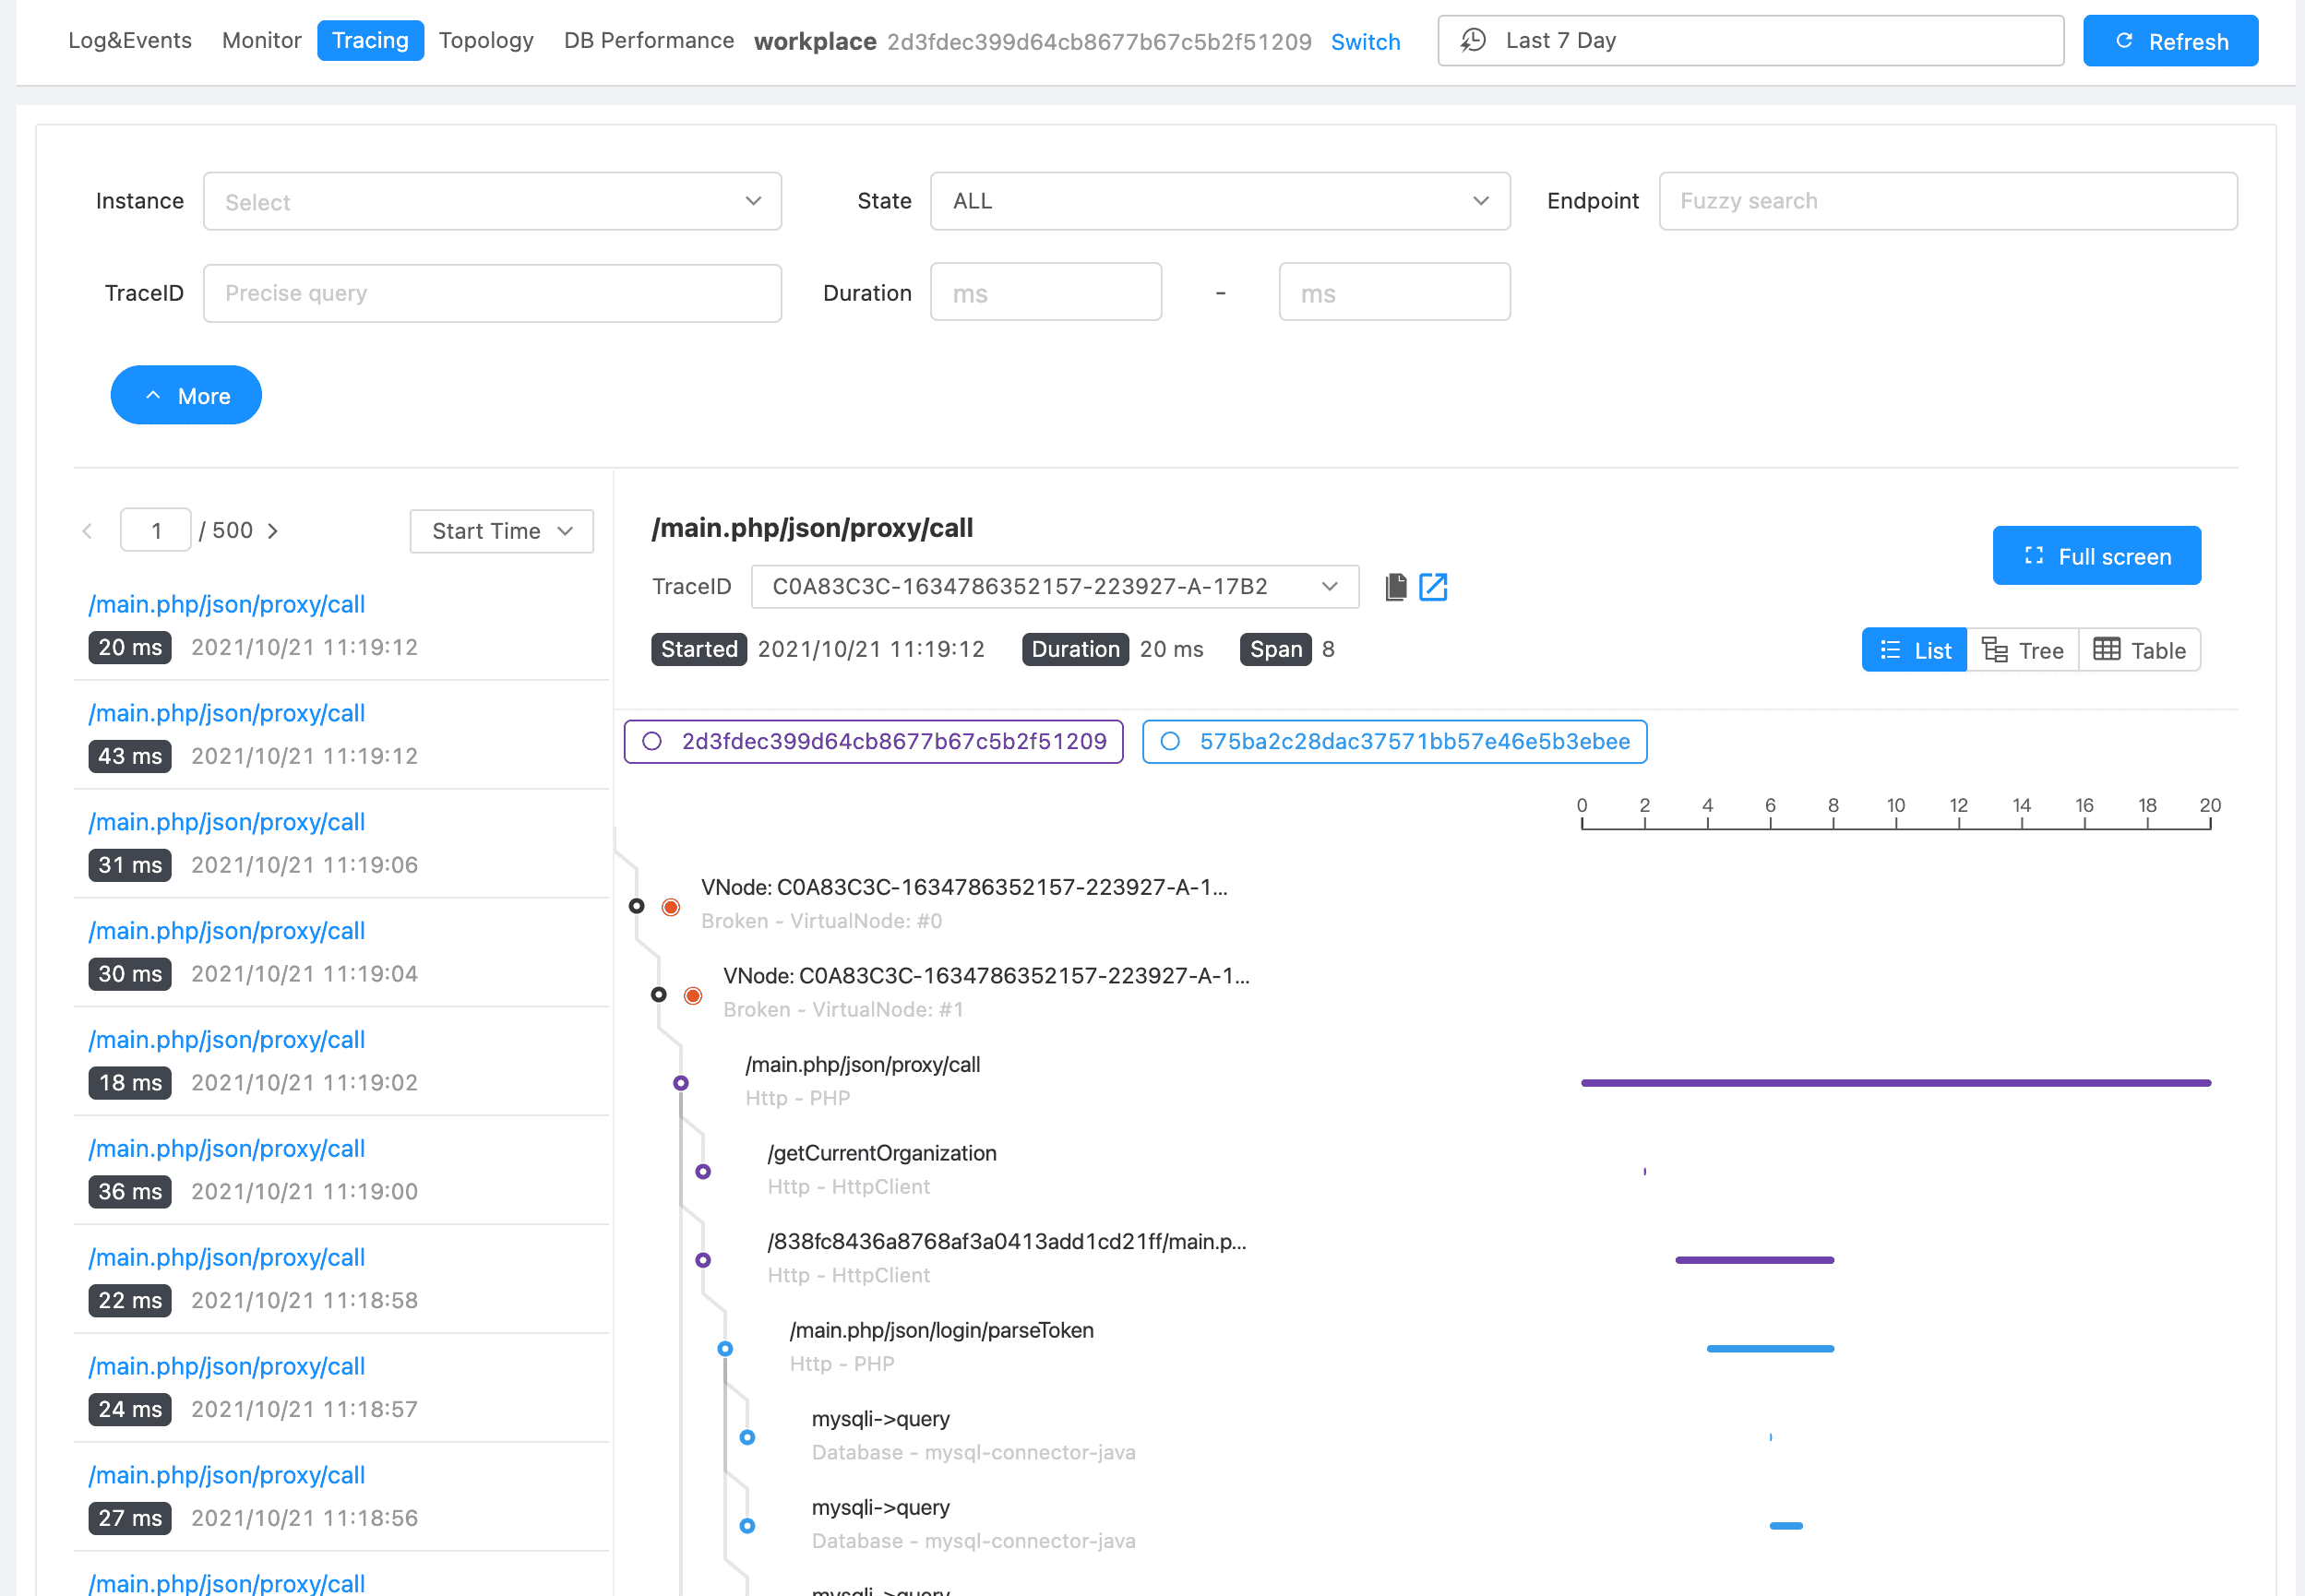
- Traces
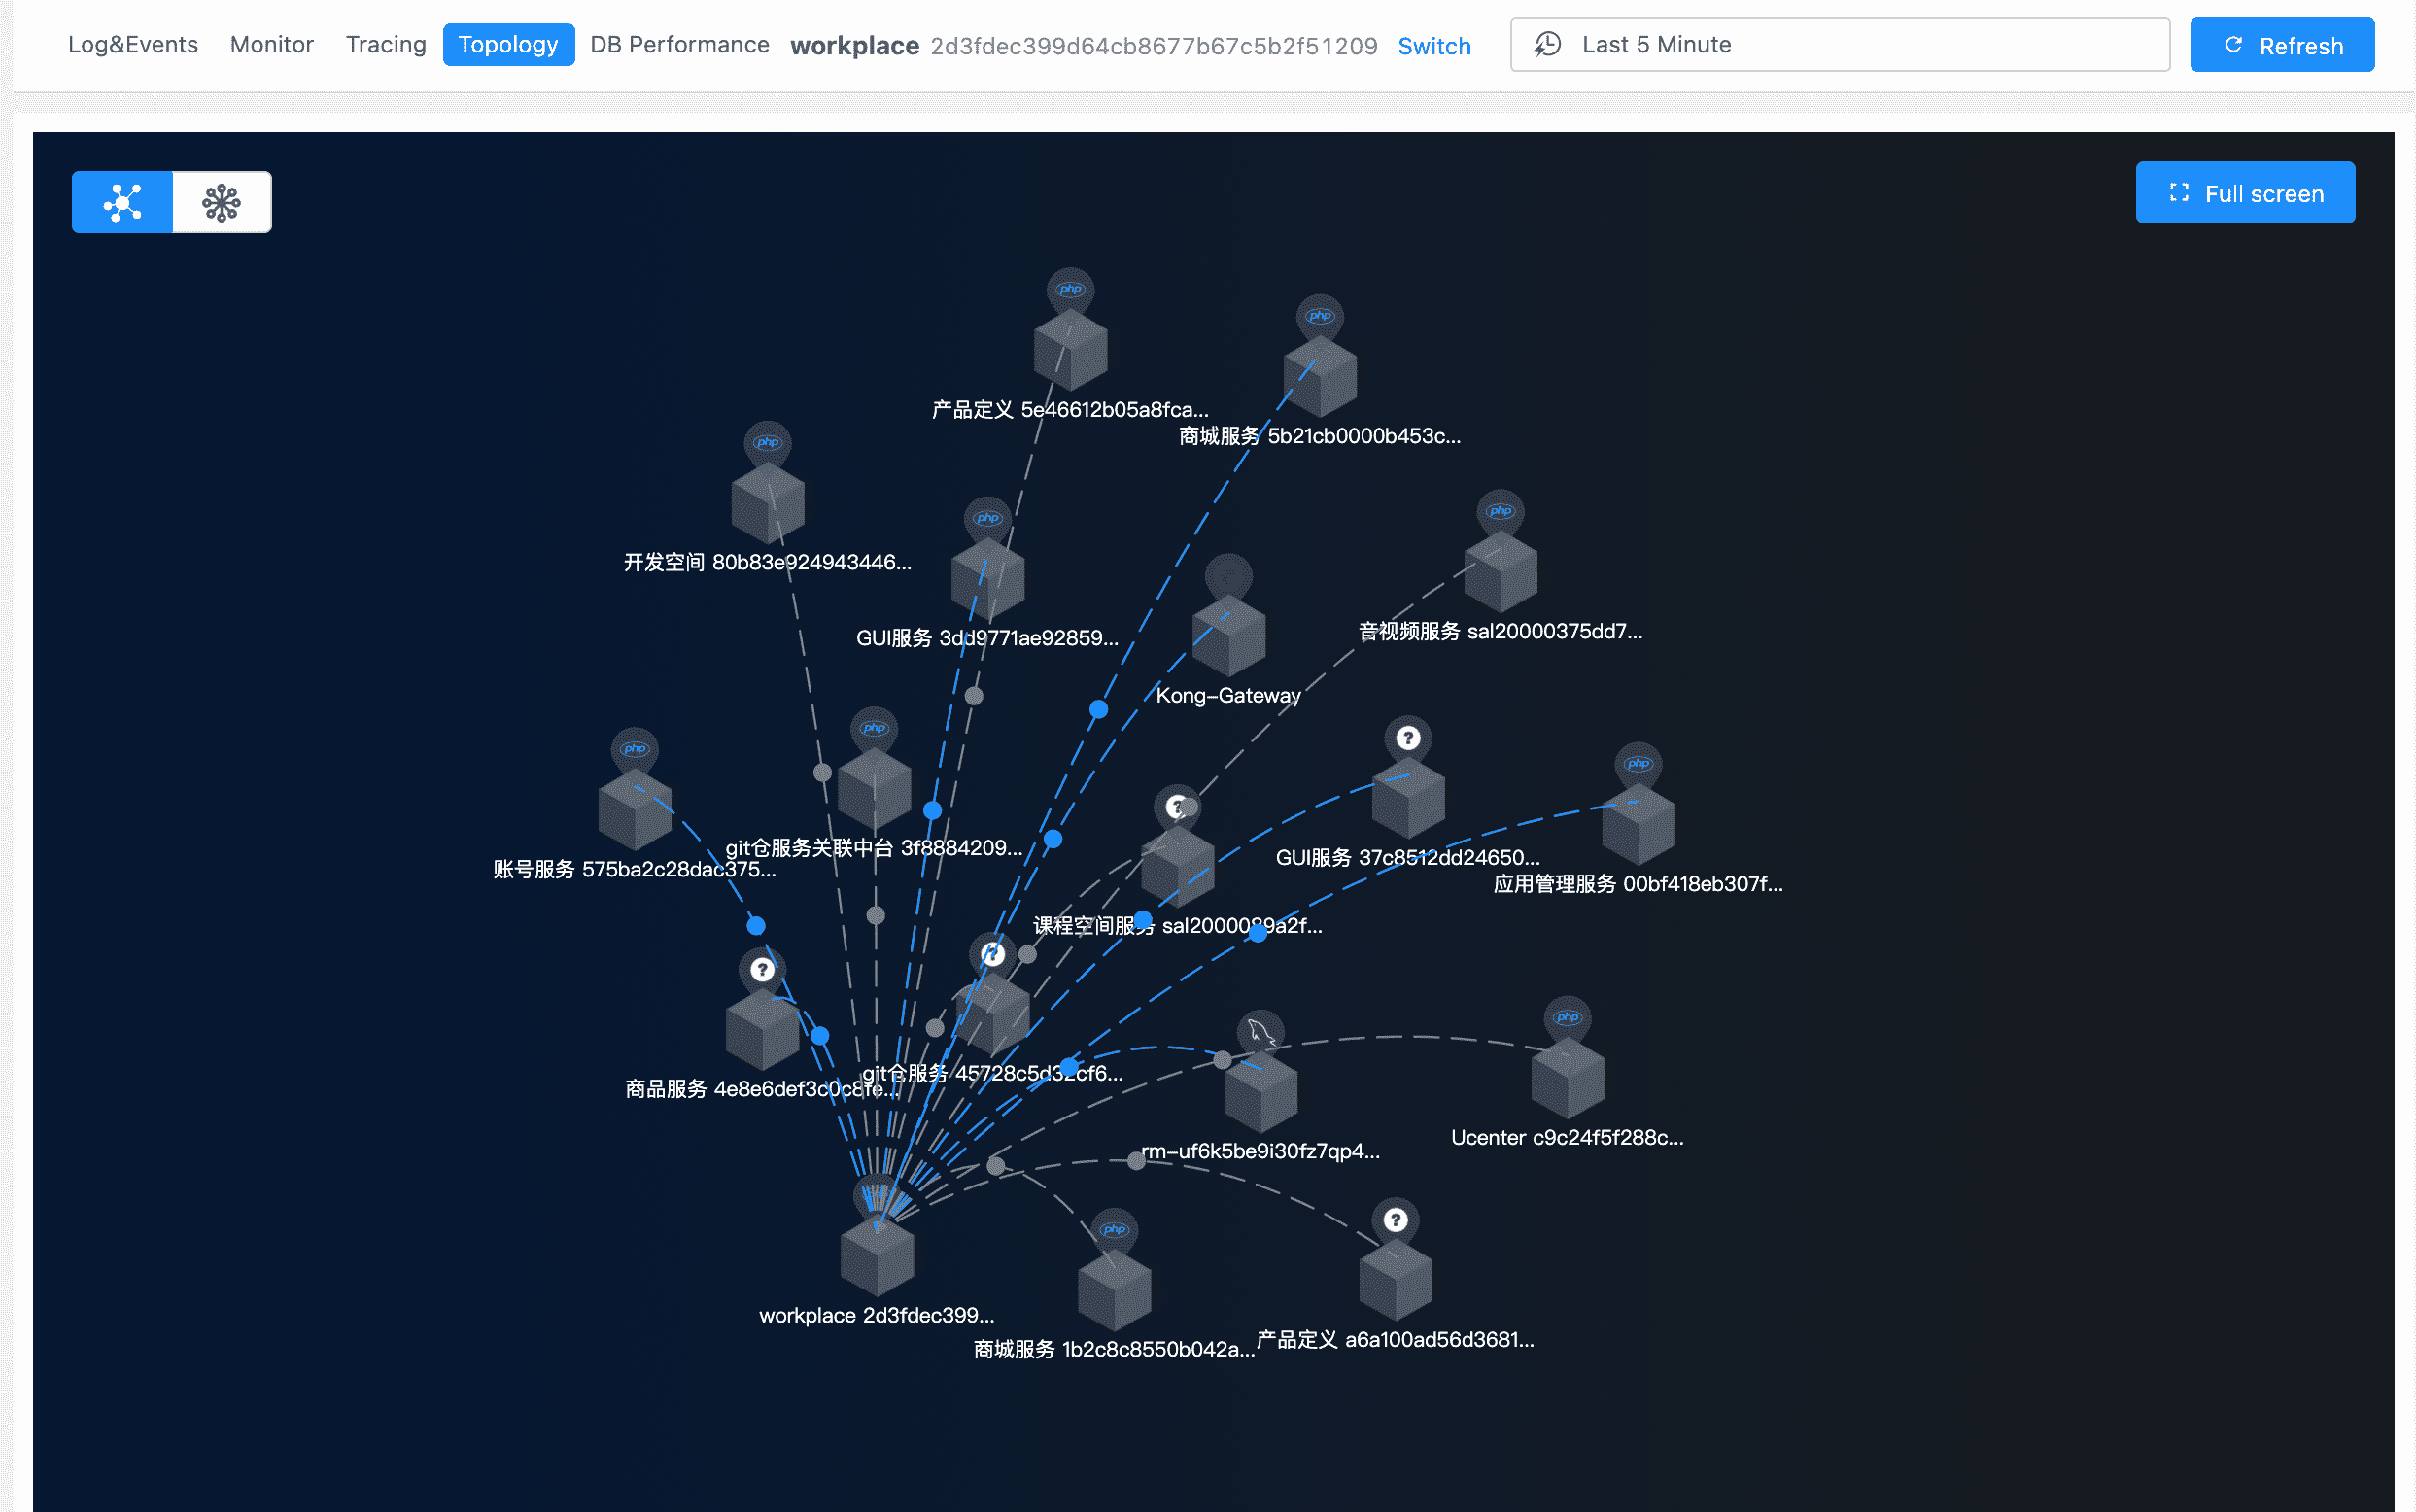
- Topology
- DB Perforamnce
These modules are scattered in various pages of “Service Management”, and the “Service Telemetry” module provides a unified entrance to observe telemetry information related to a specific service.
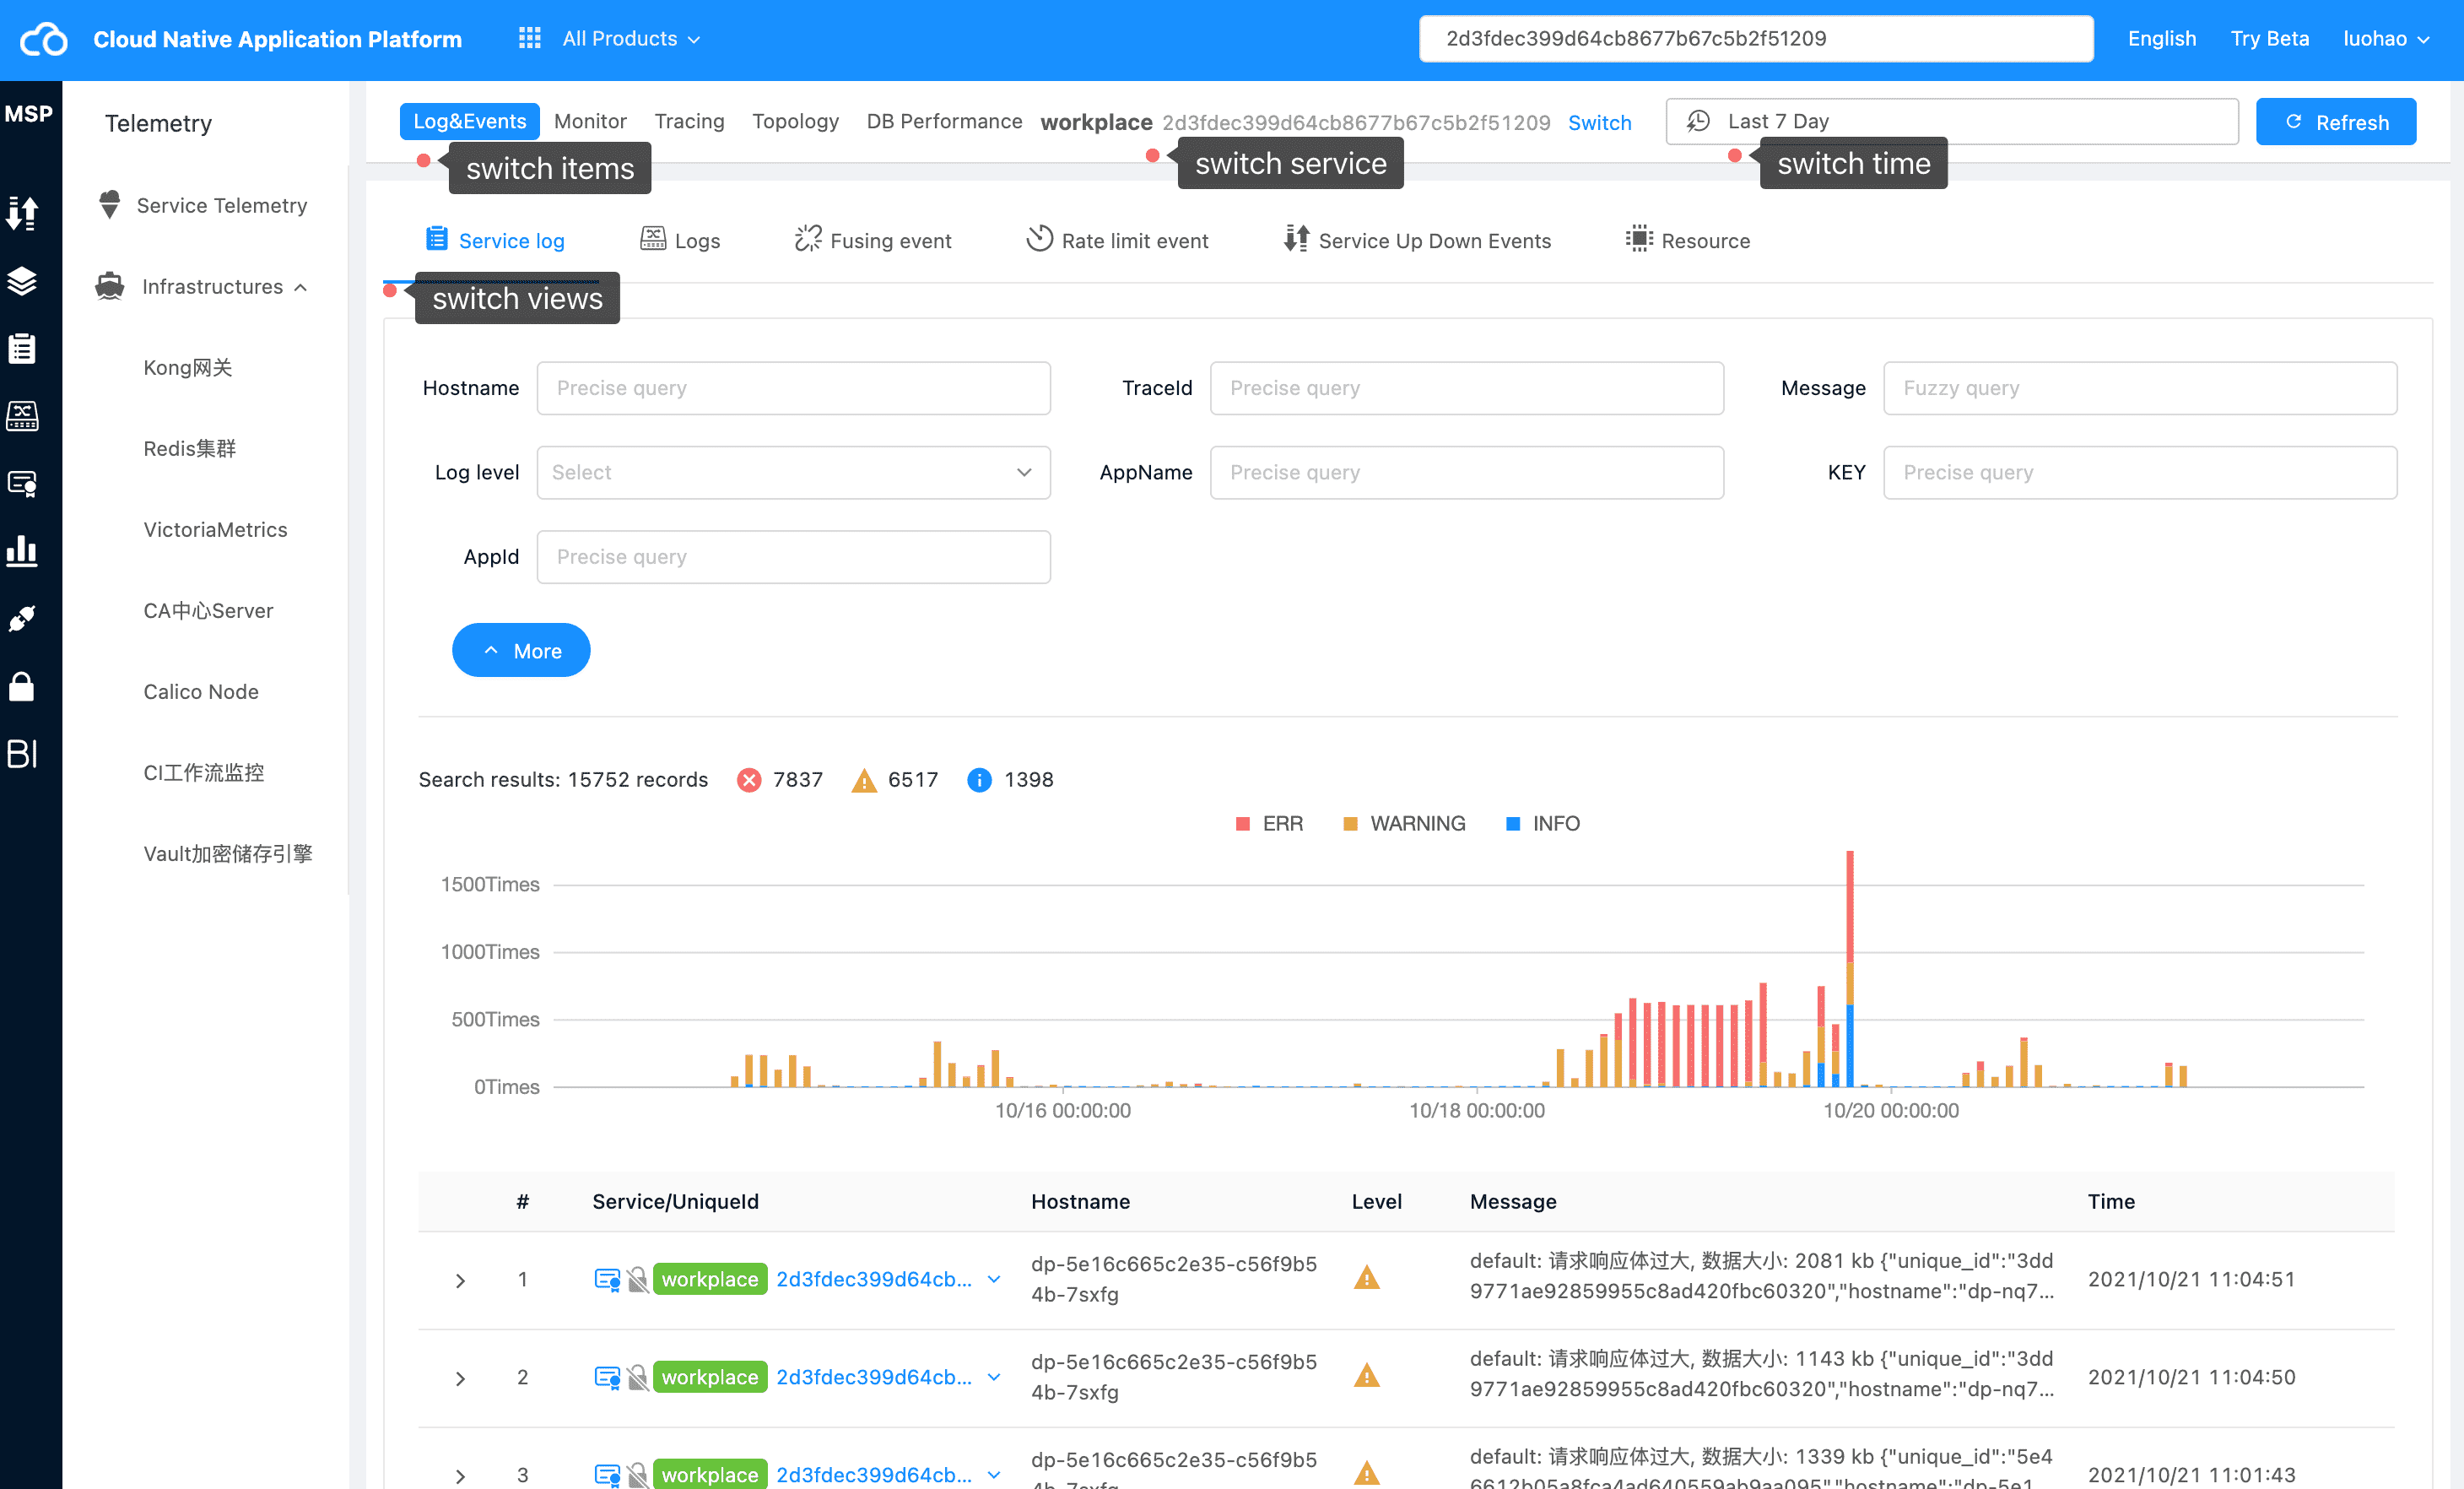
Operation Areas #
- Top Area
- Service switching
- Time switch
- Observation item switching
- Bottom Area
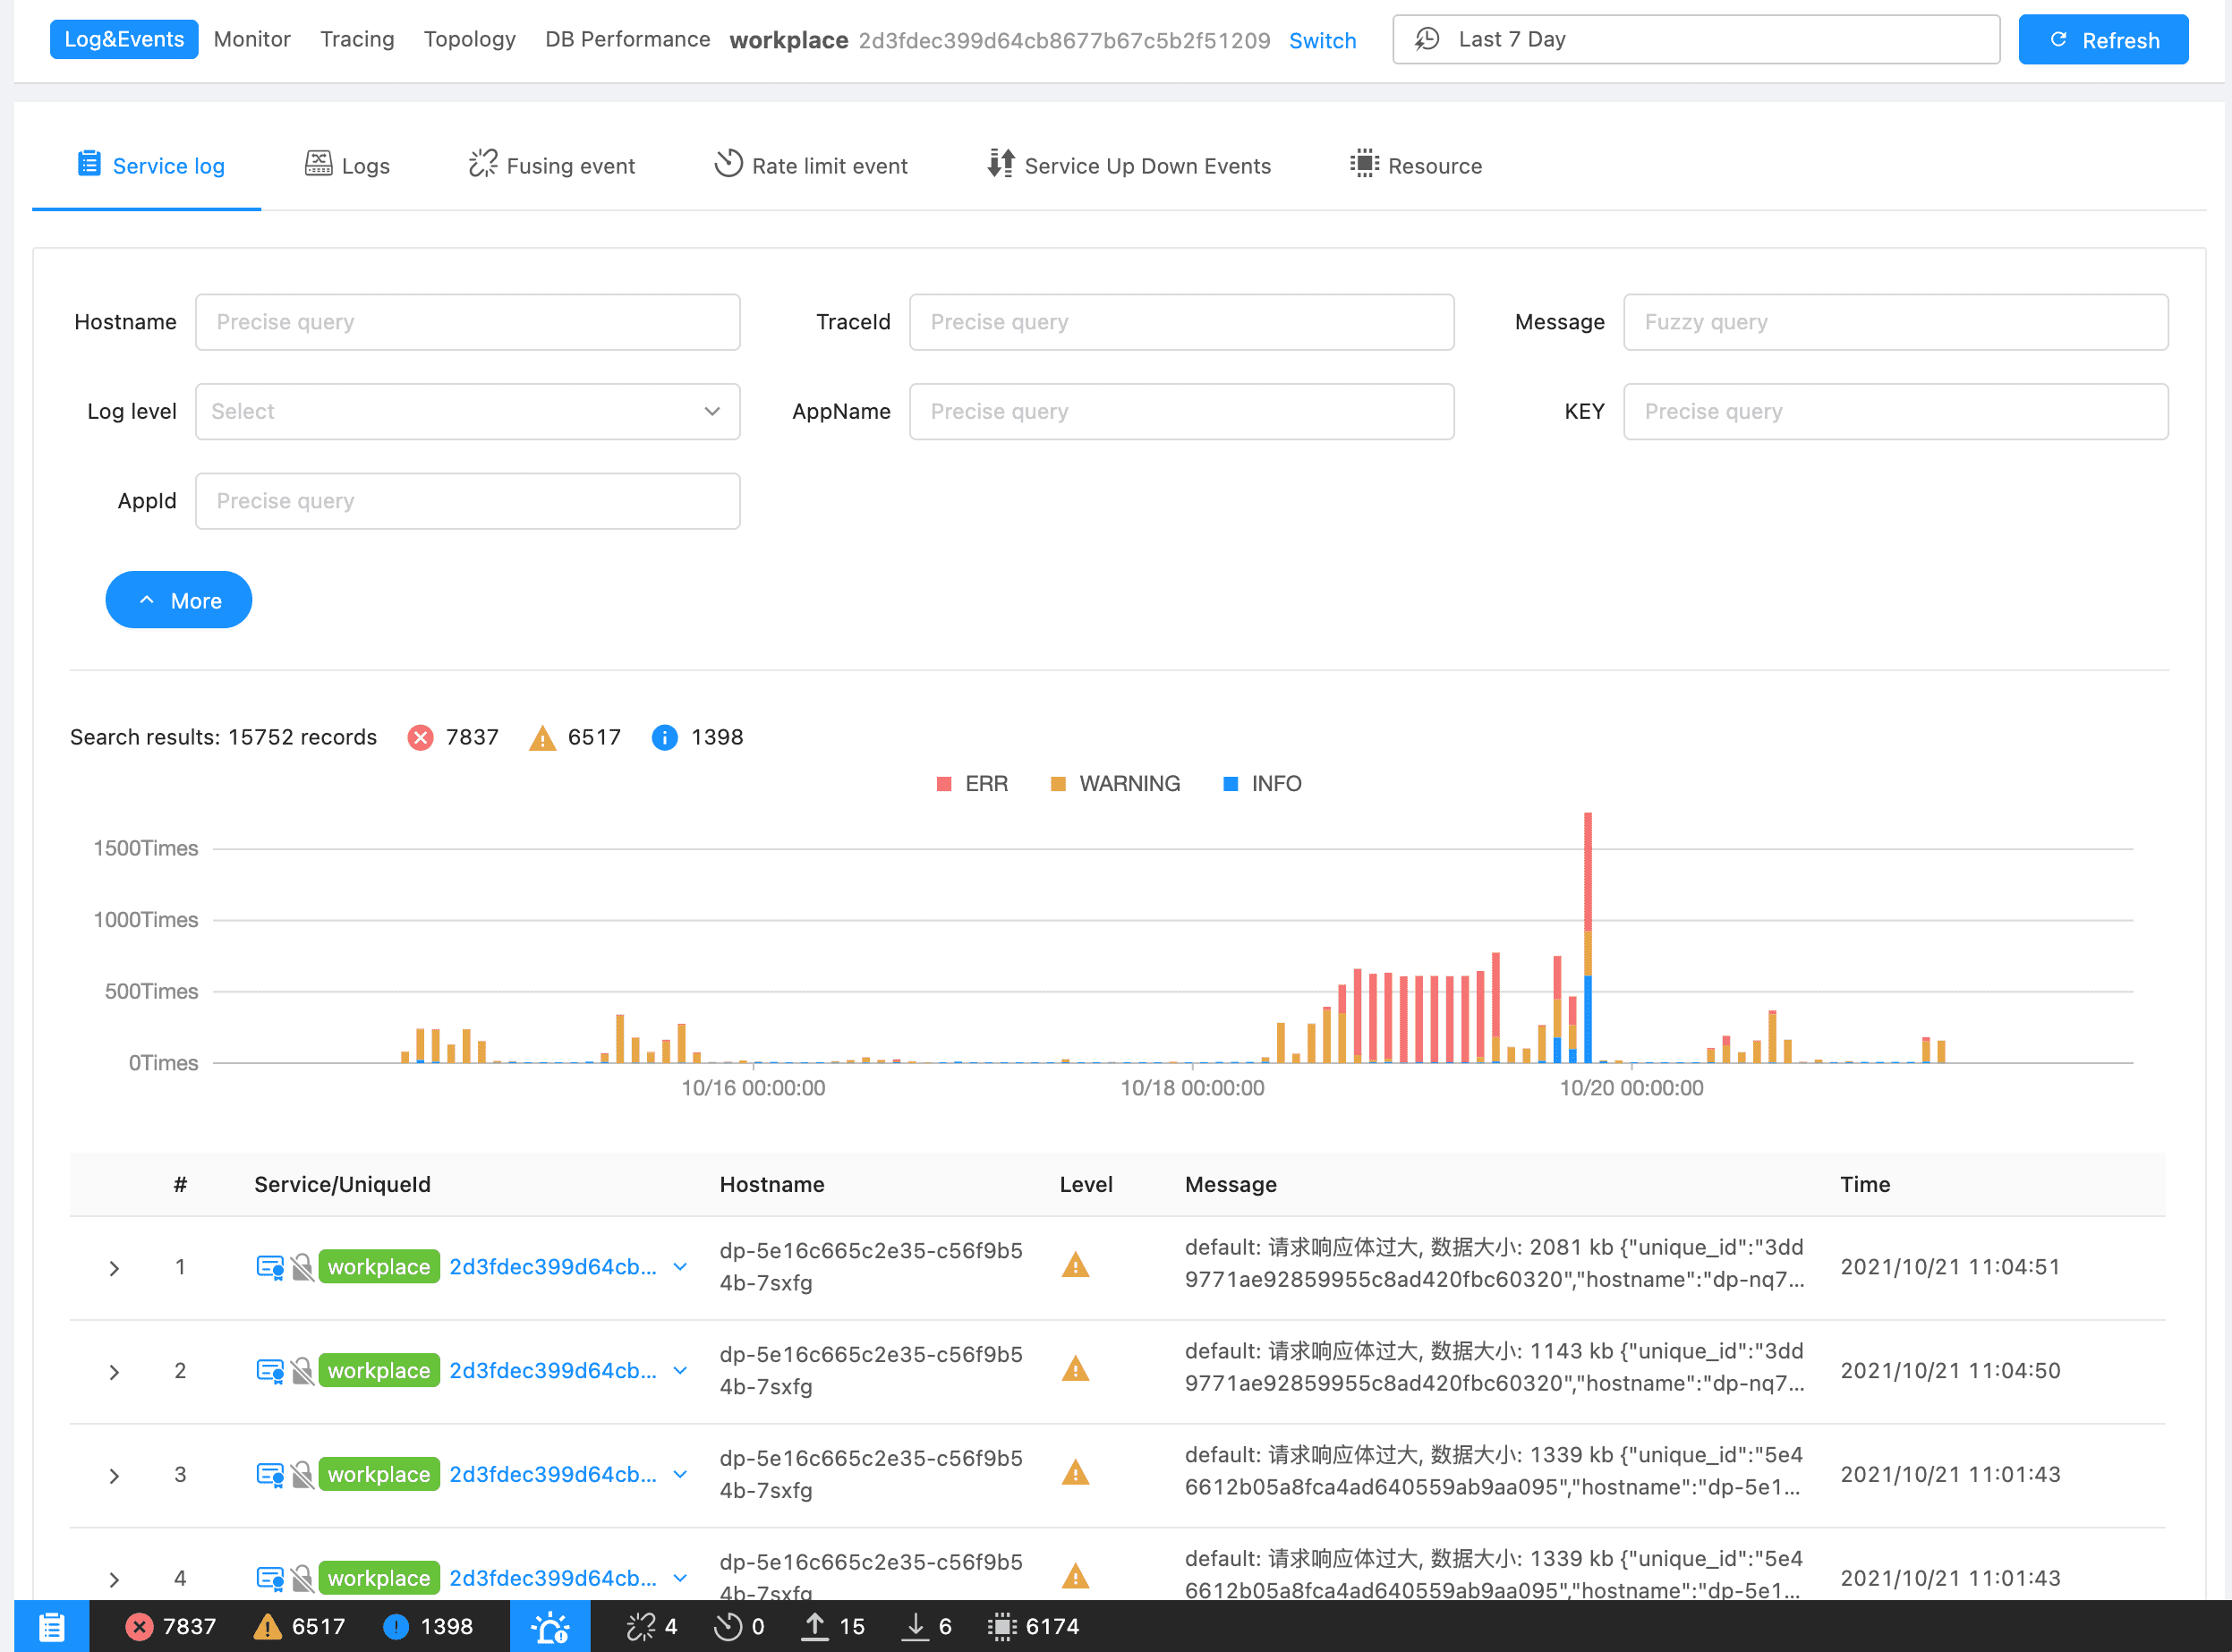
- Display the statistics of each event
Top Area #

Switch monitoring items
Bottom Events Status Bar #

Summary the events and display on bottom bar, you can view detail by clicking icon
Log&Event #
Service Logs #
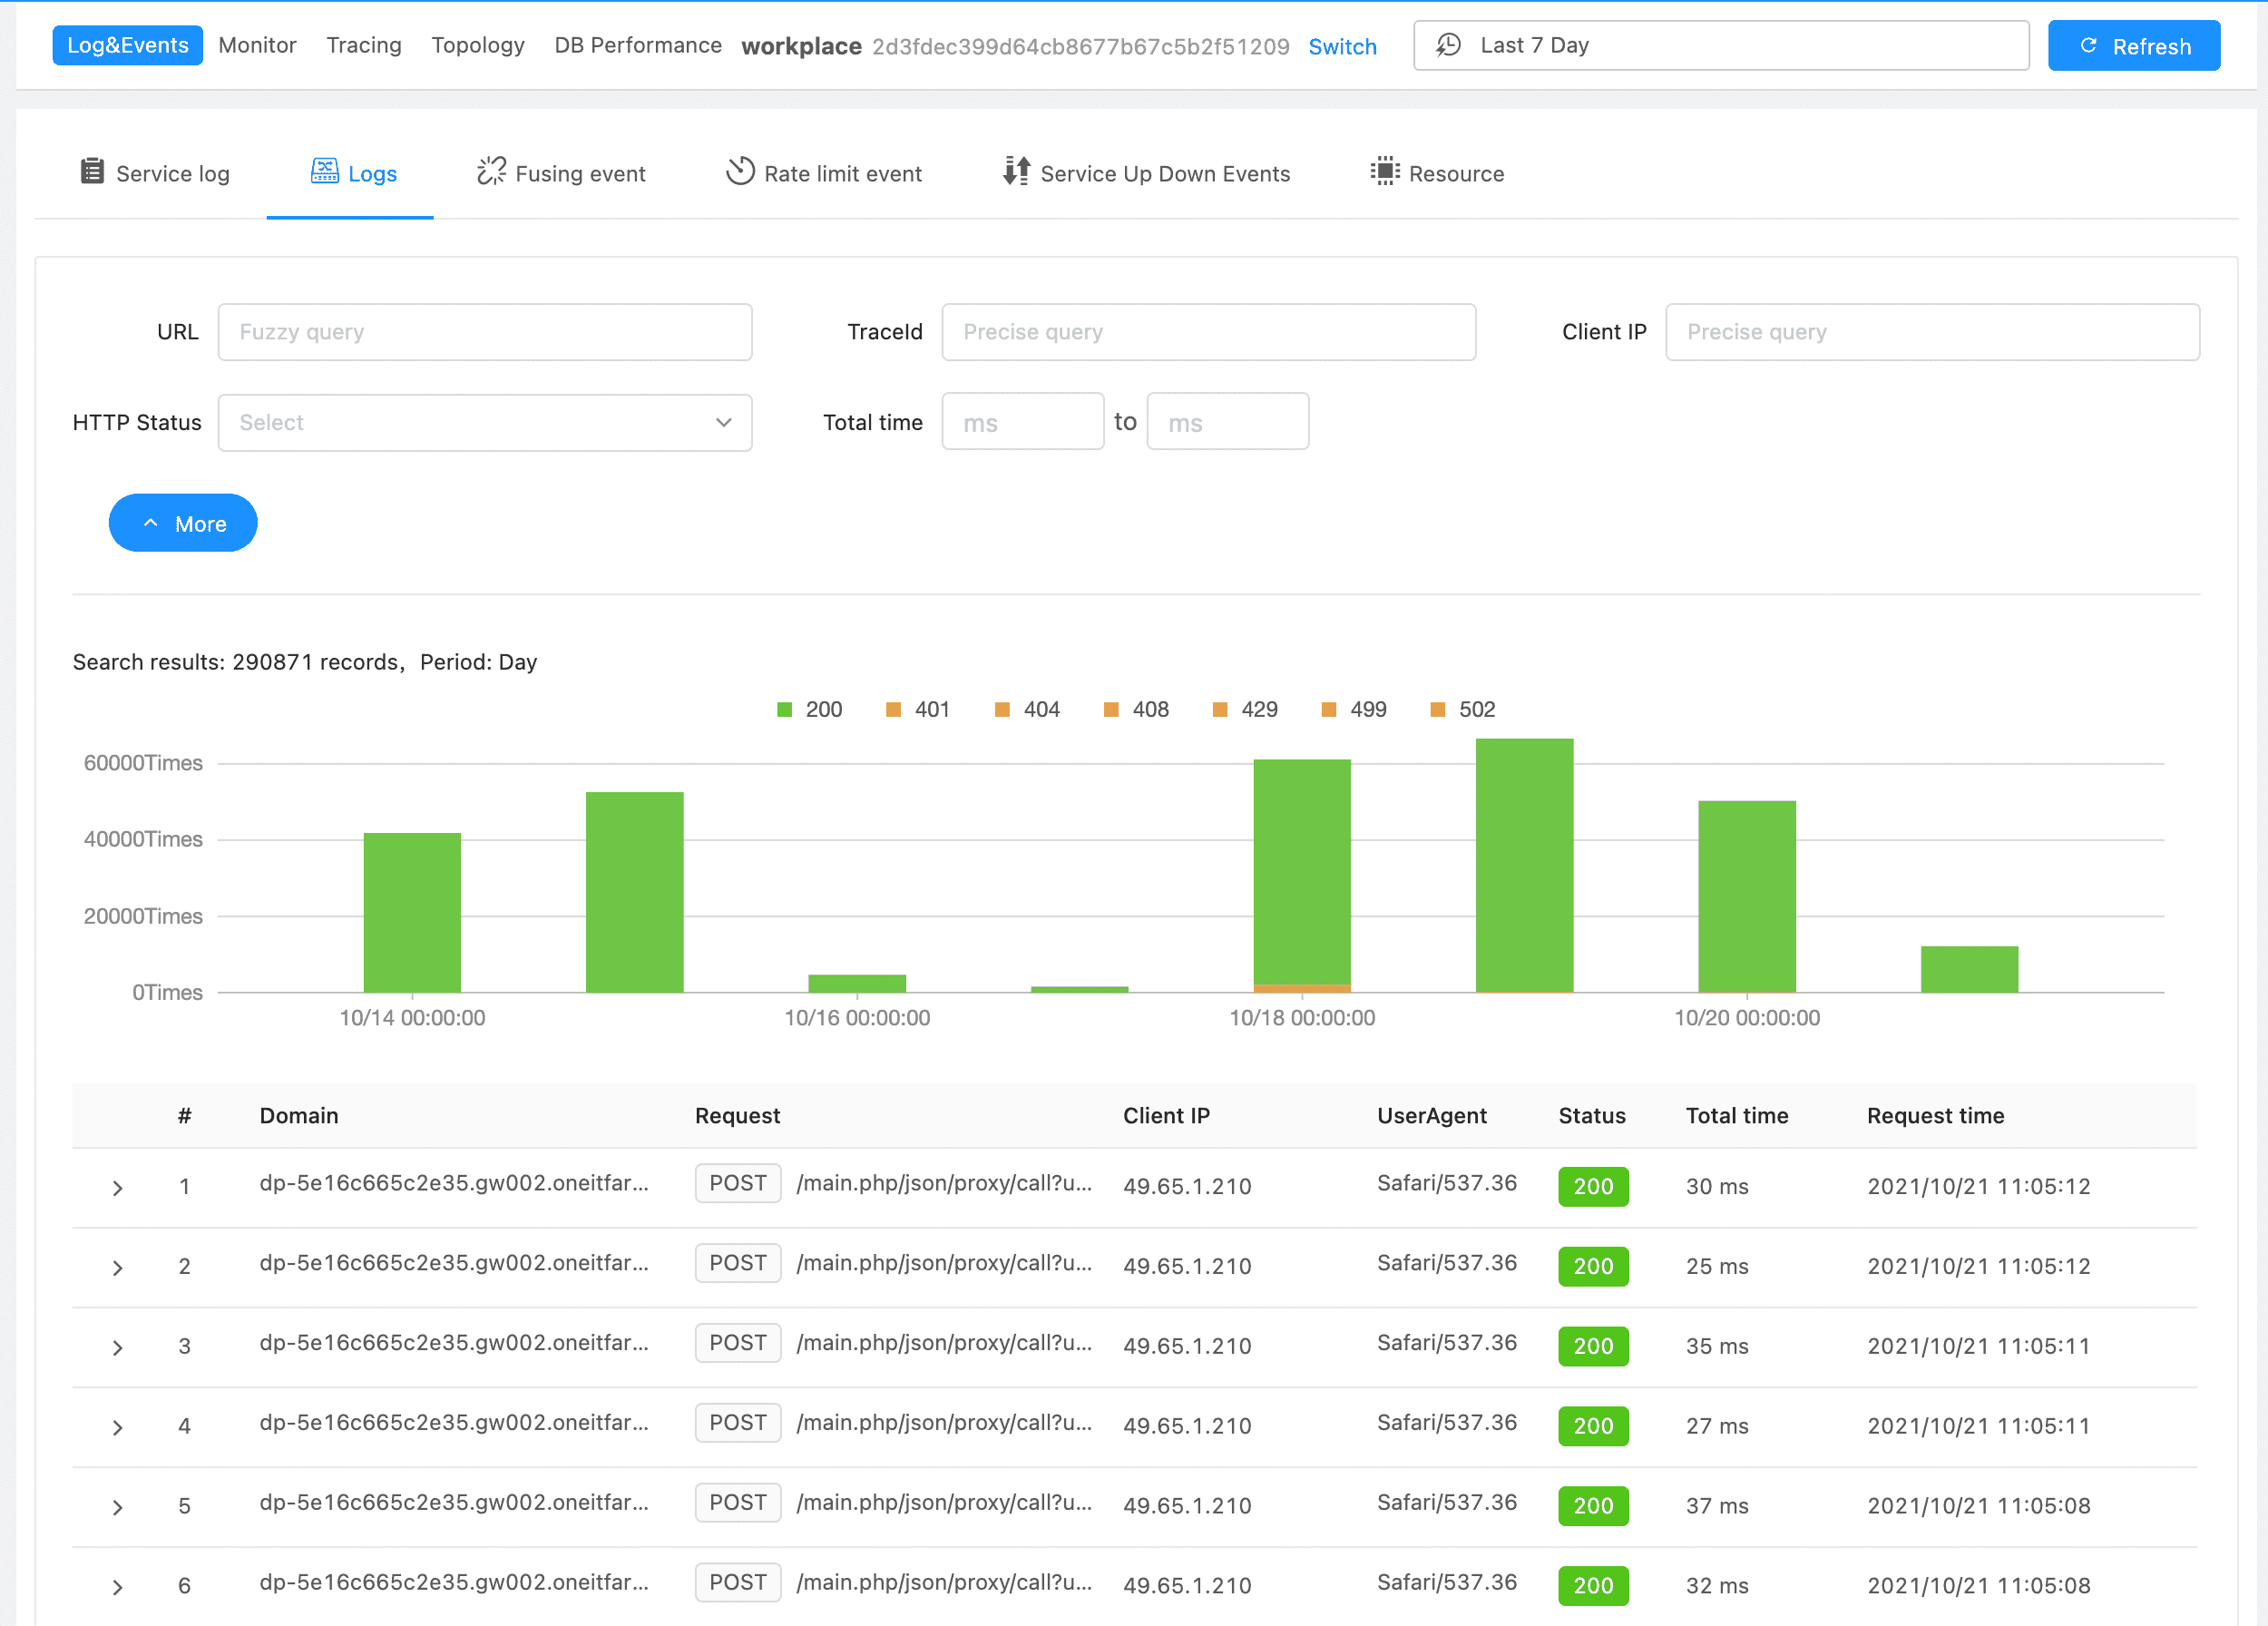
Gateway Logs #
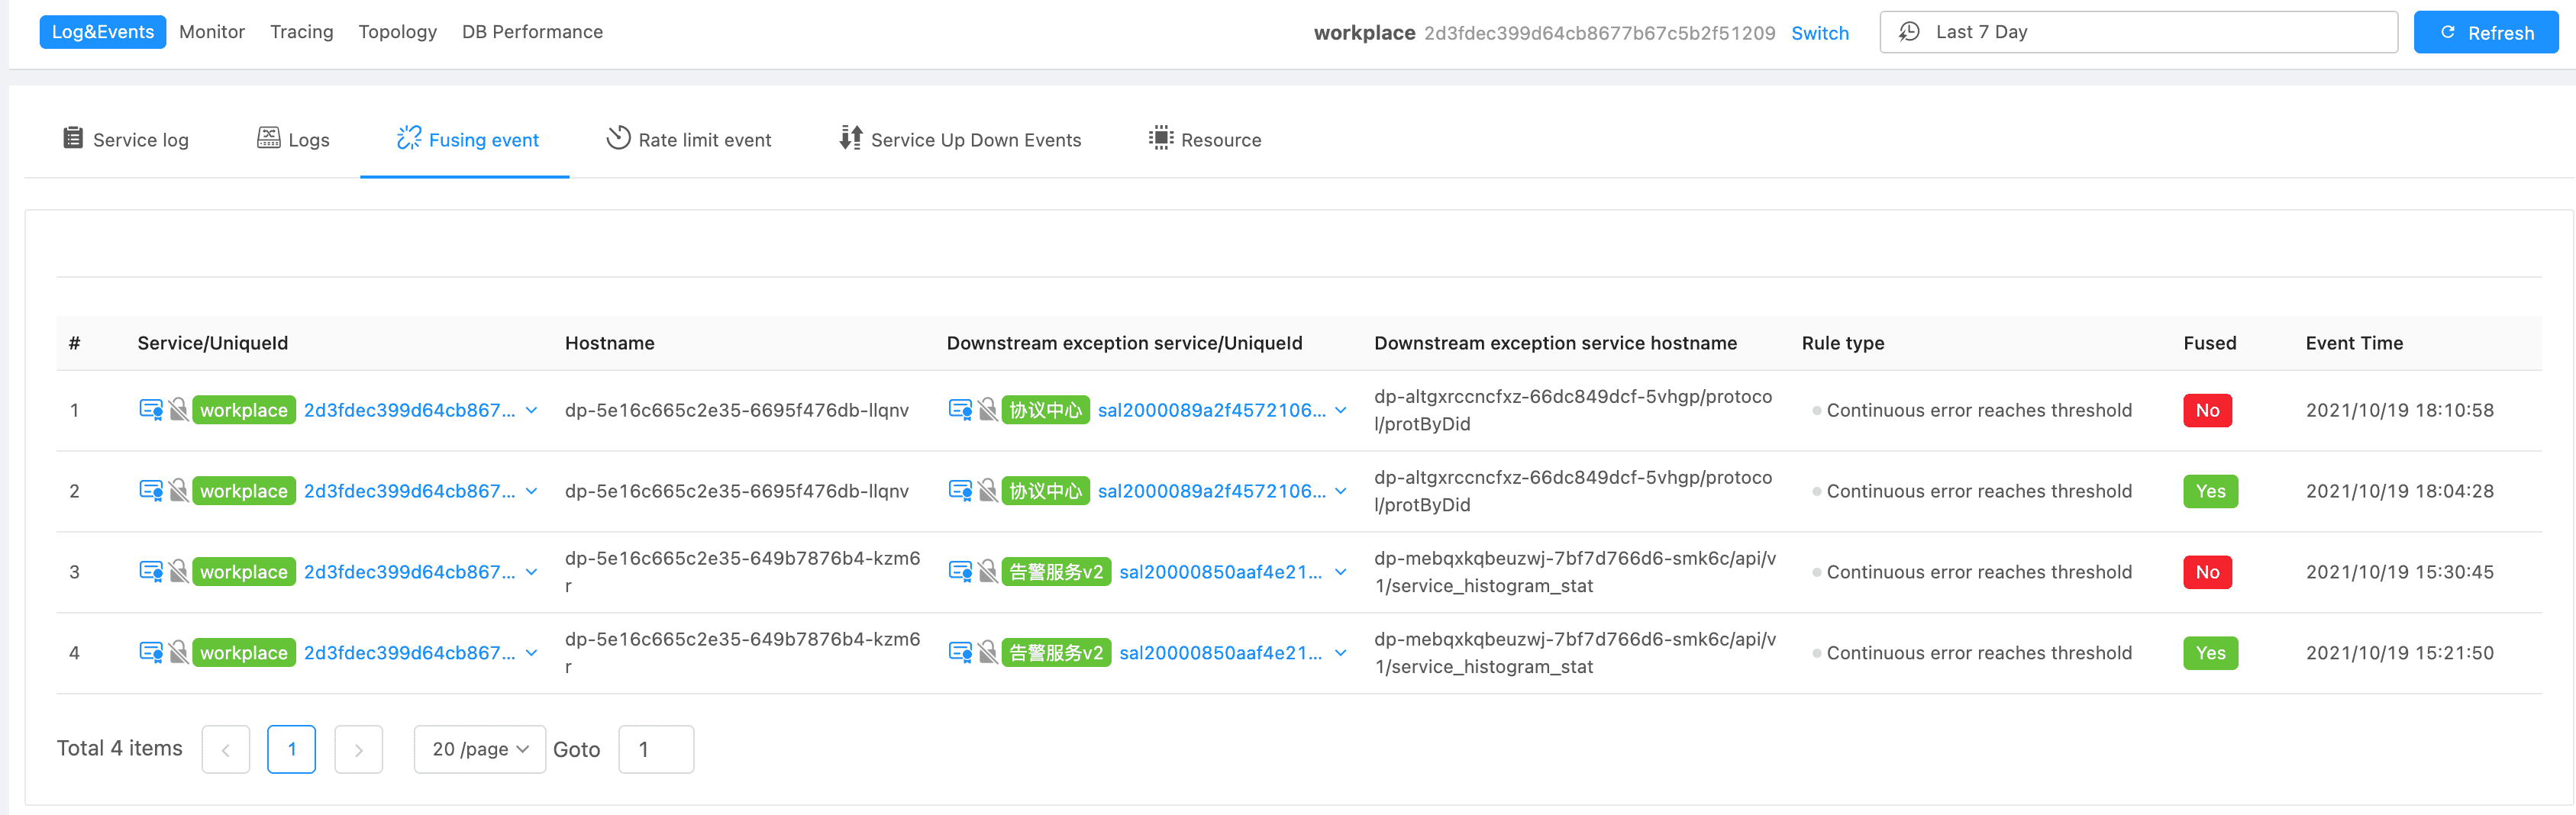
Fuse Events #
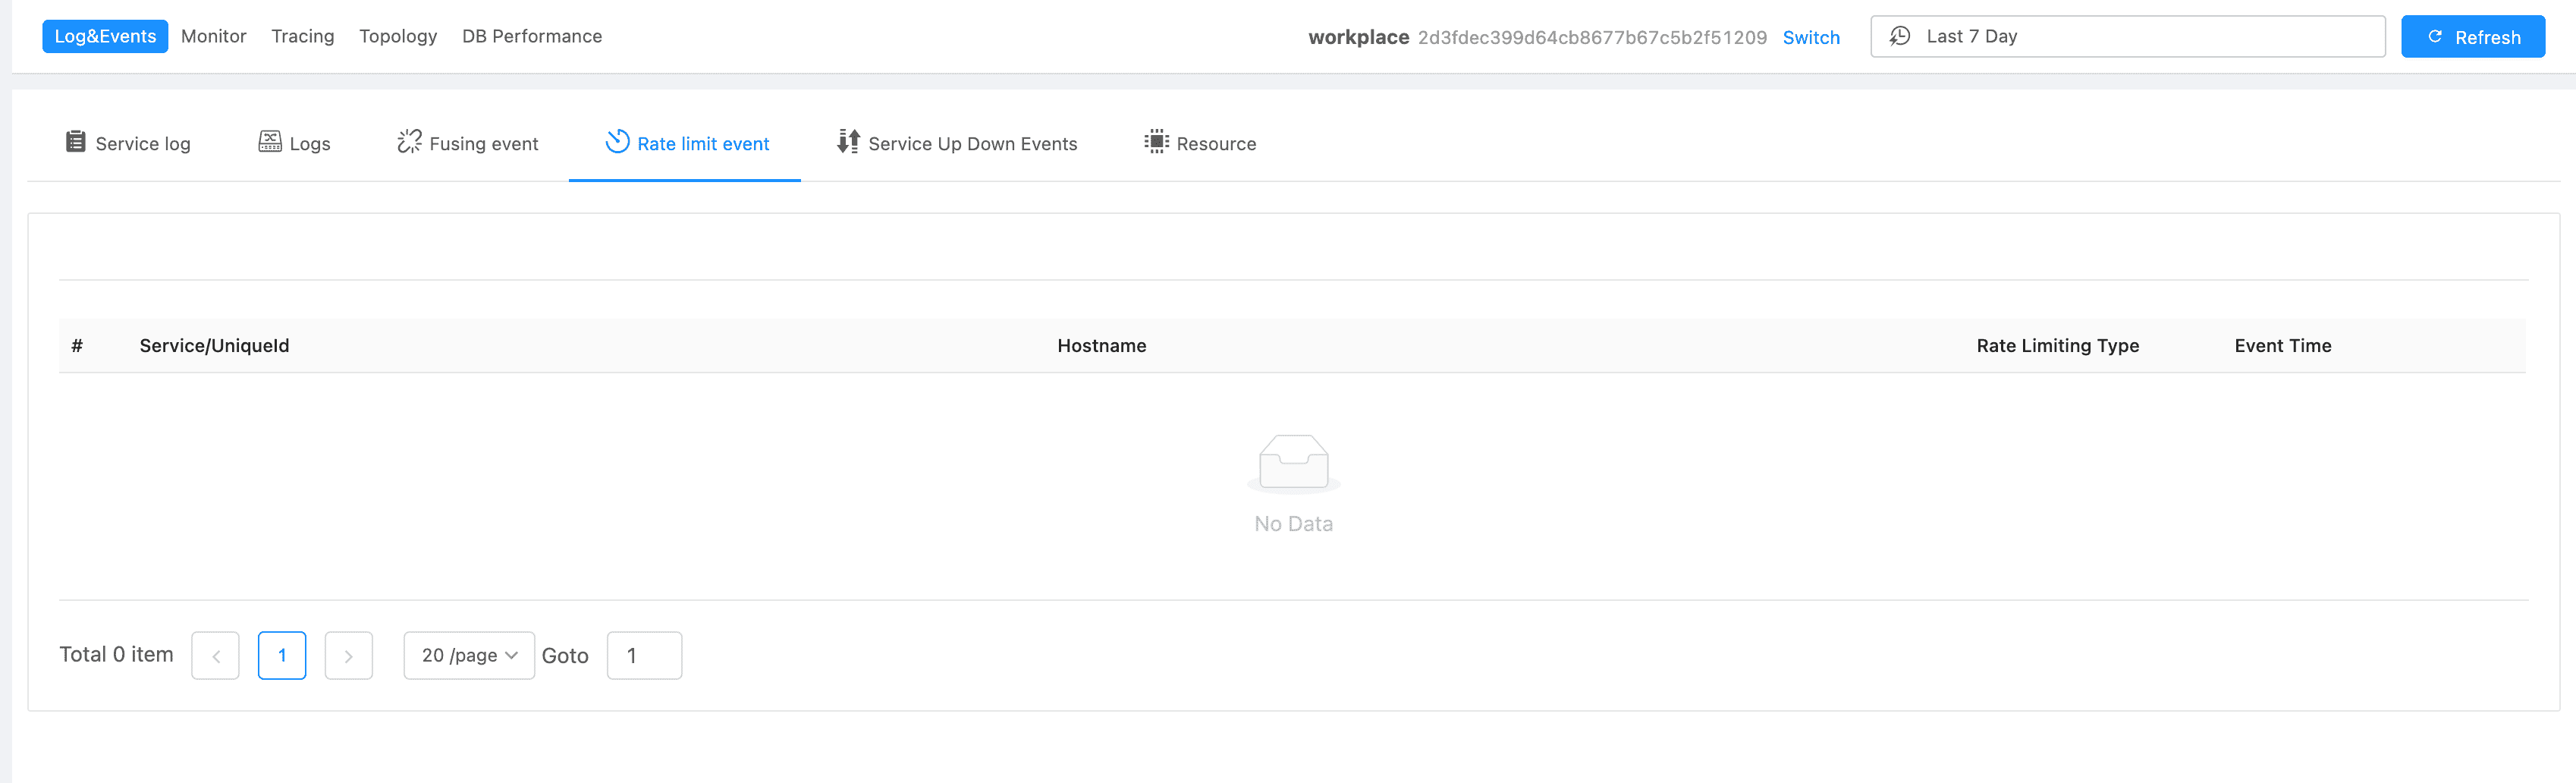
Rate Limit Events #
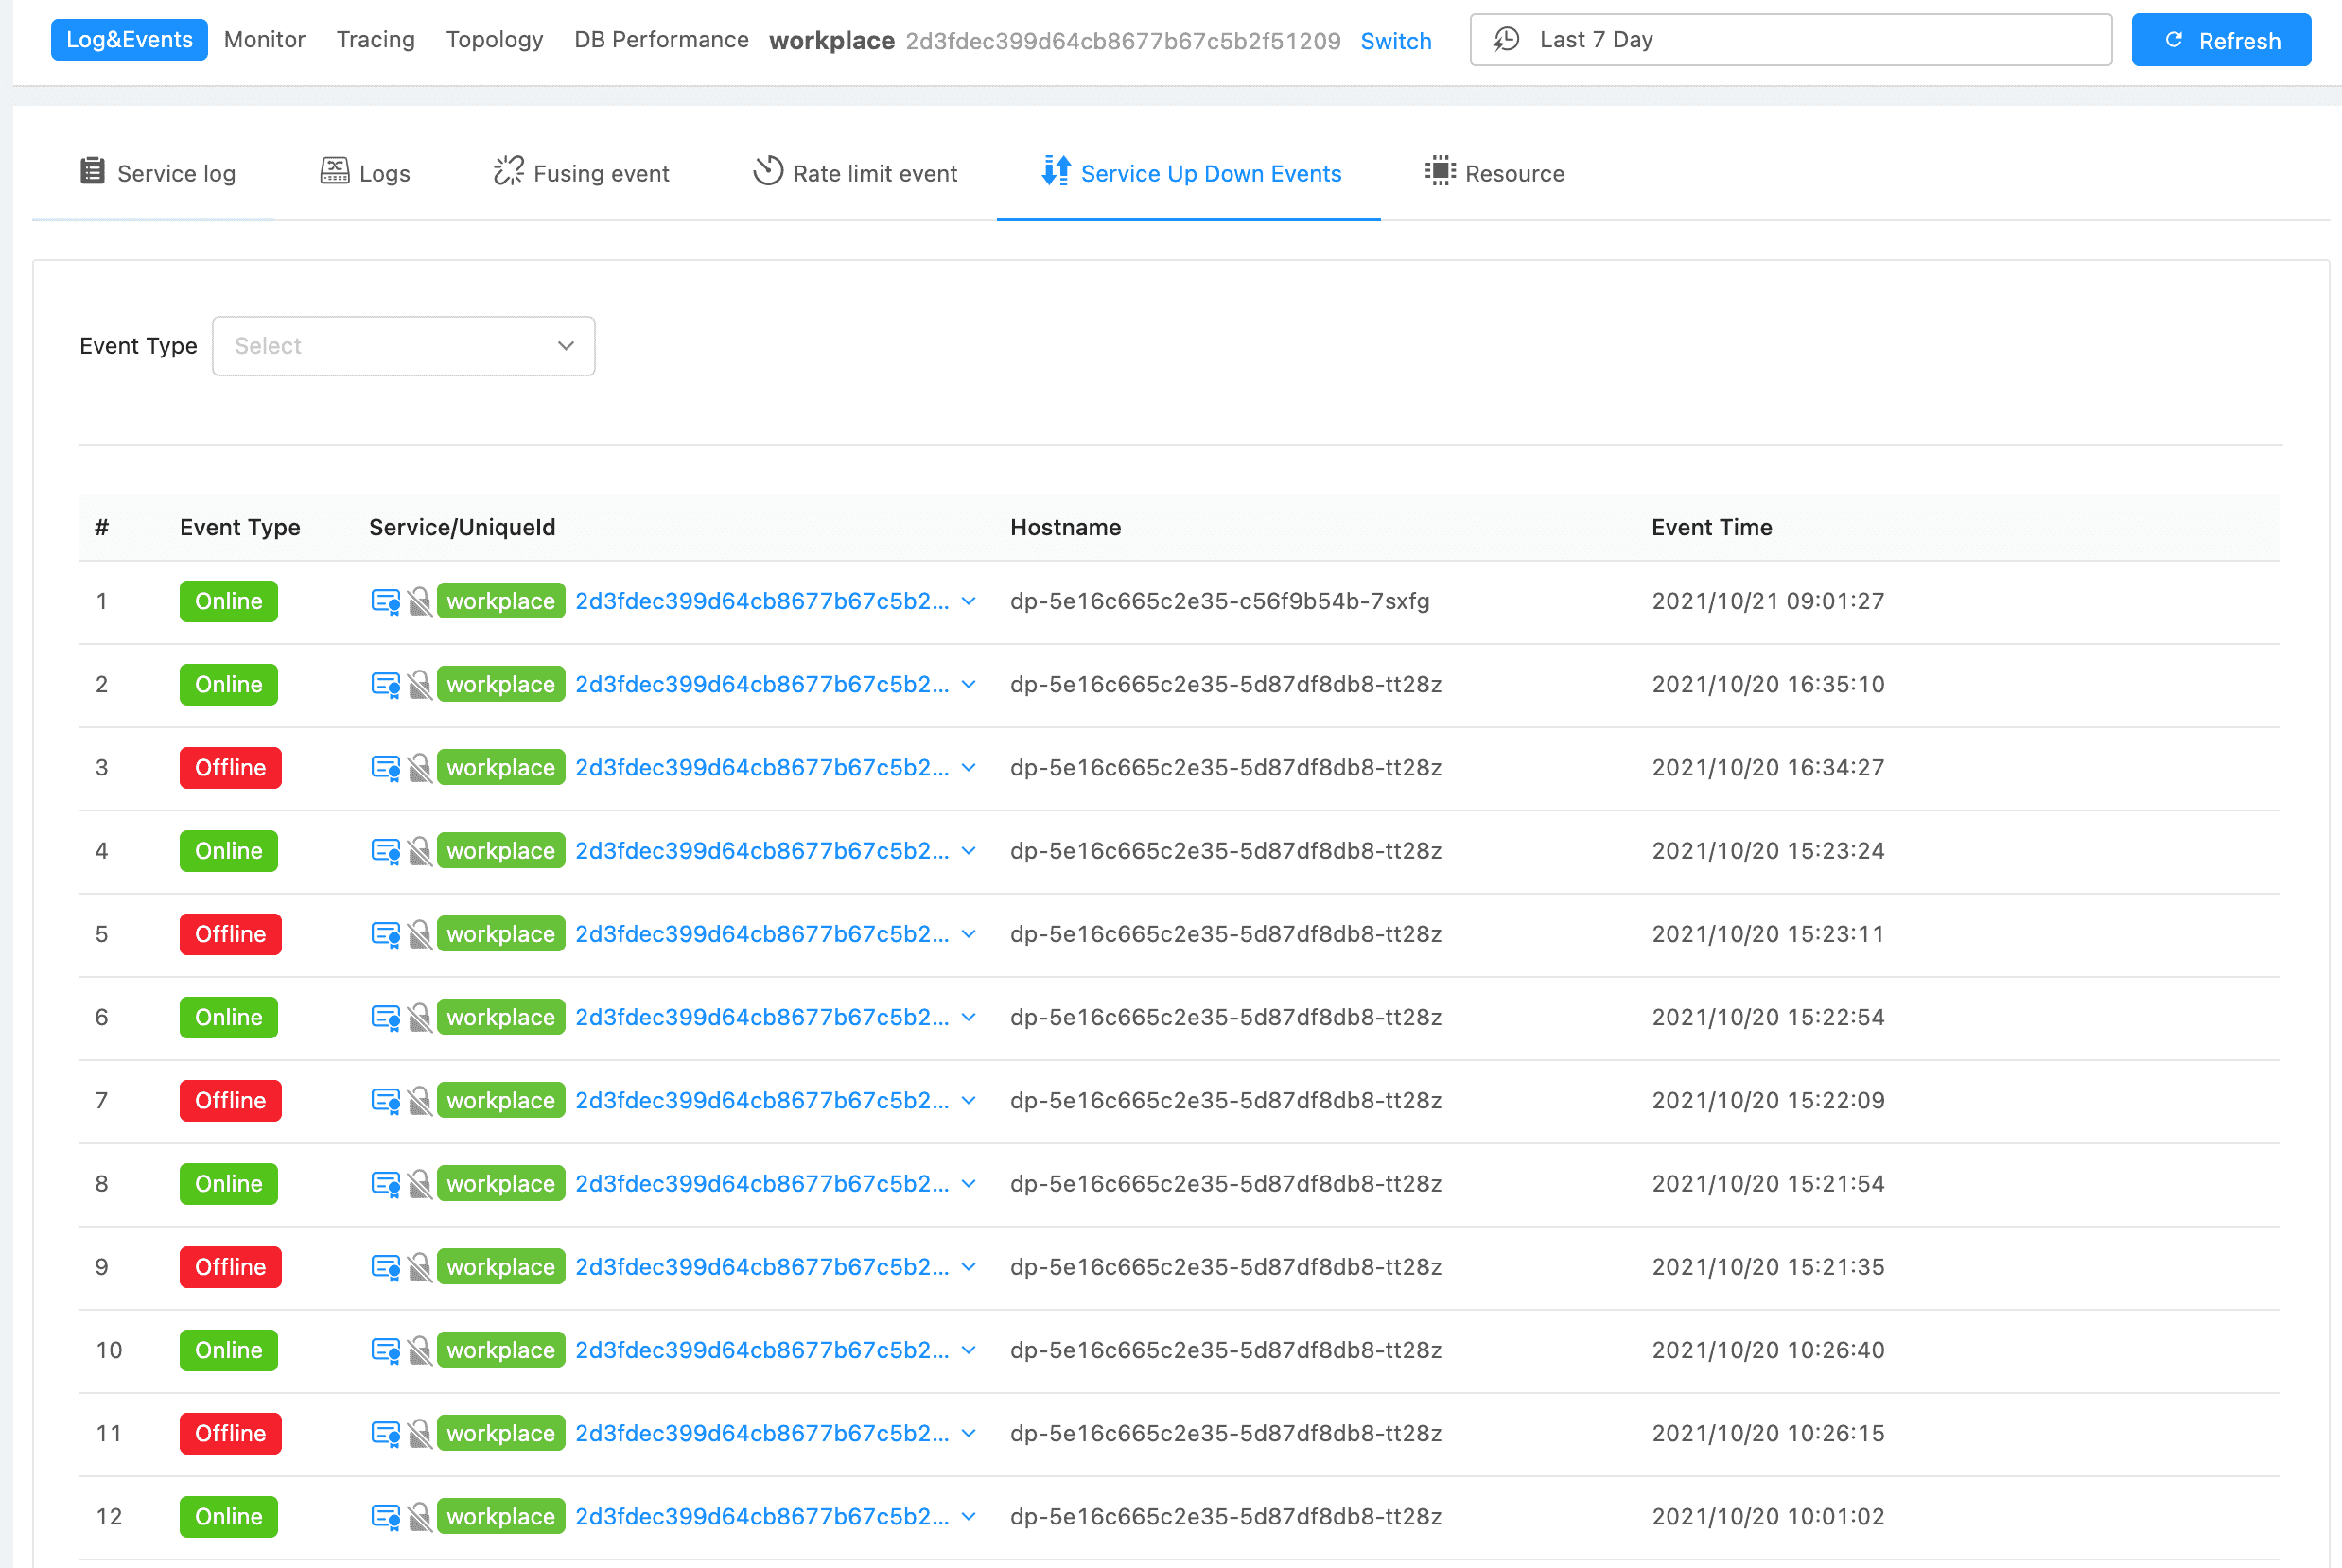
Service Up&Down #
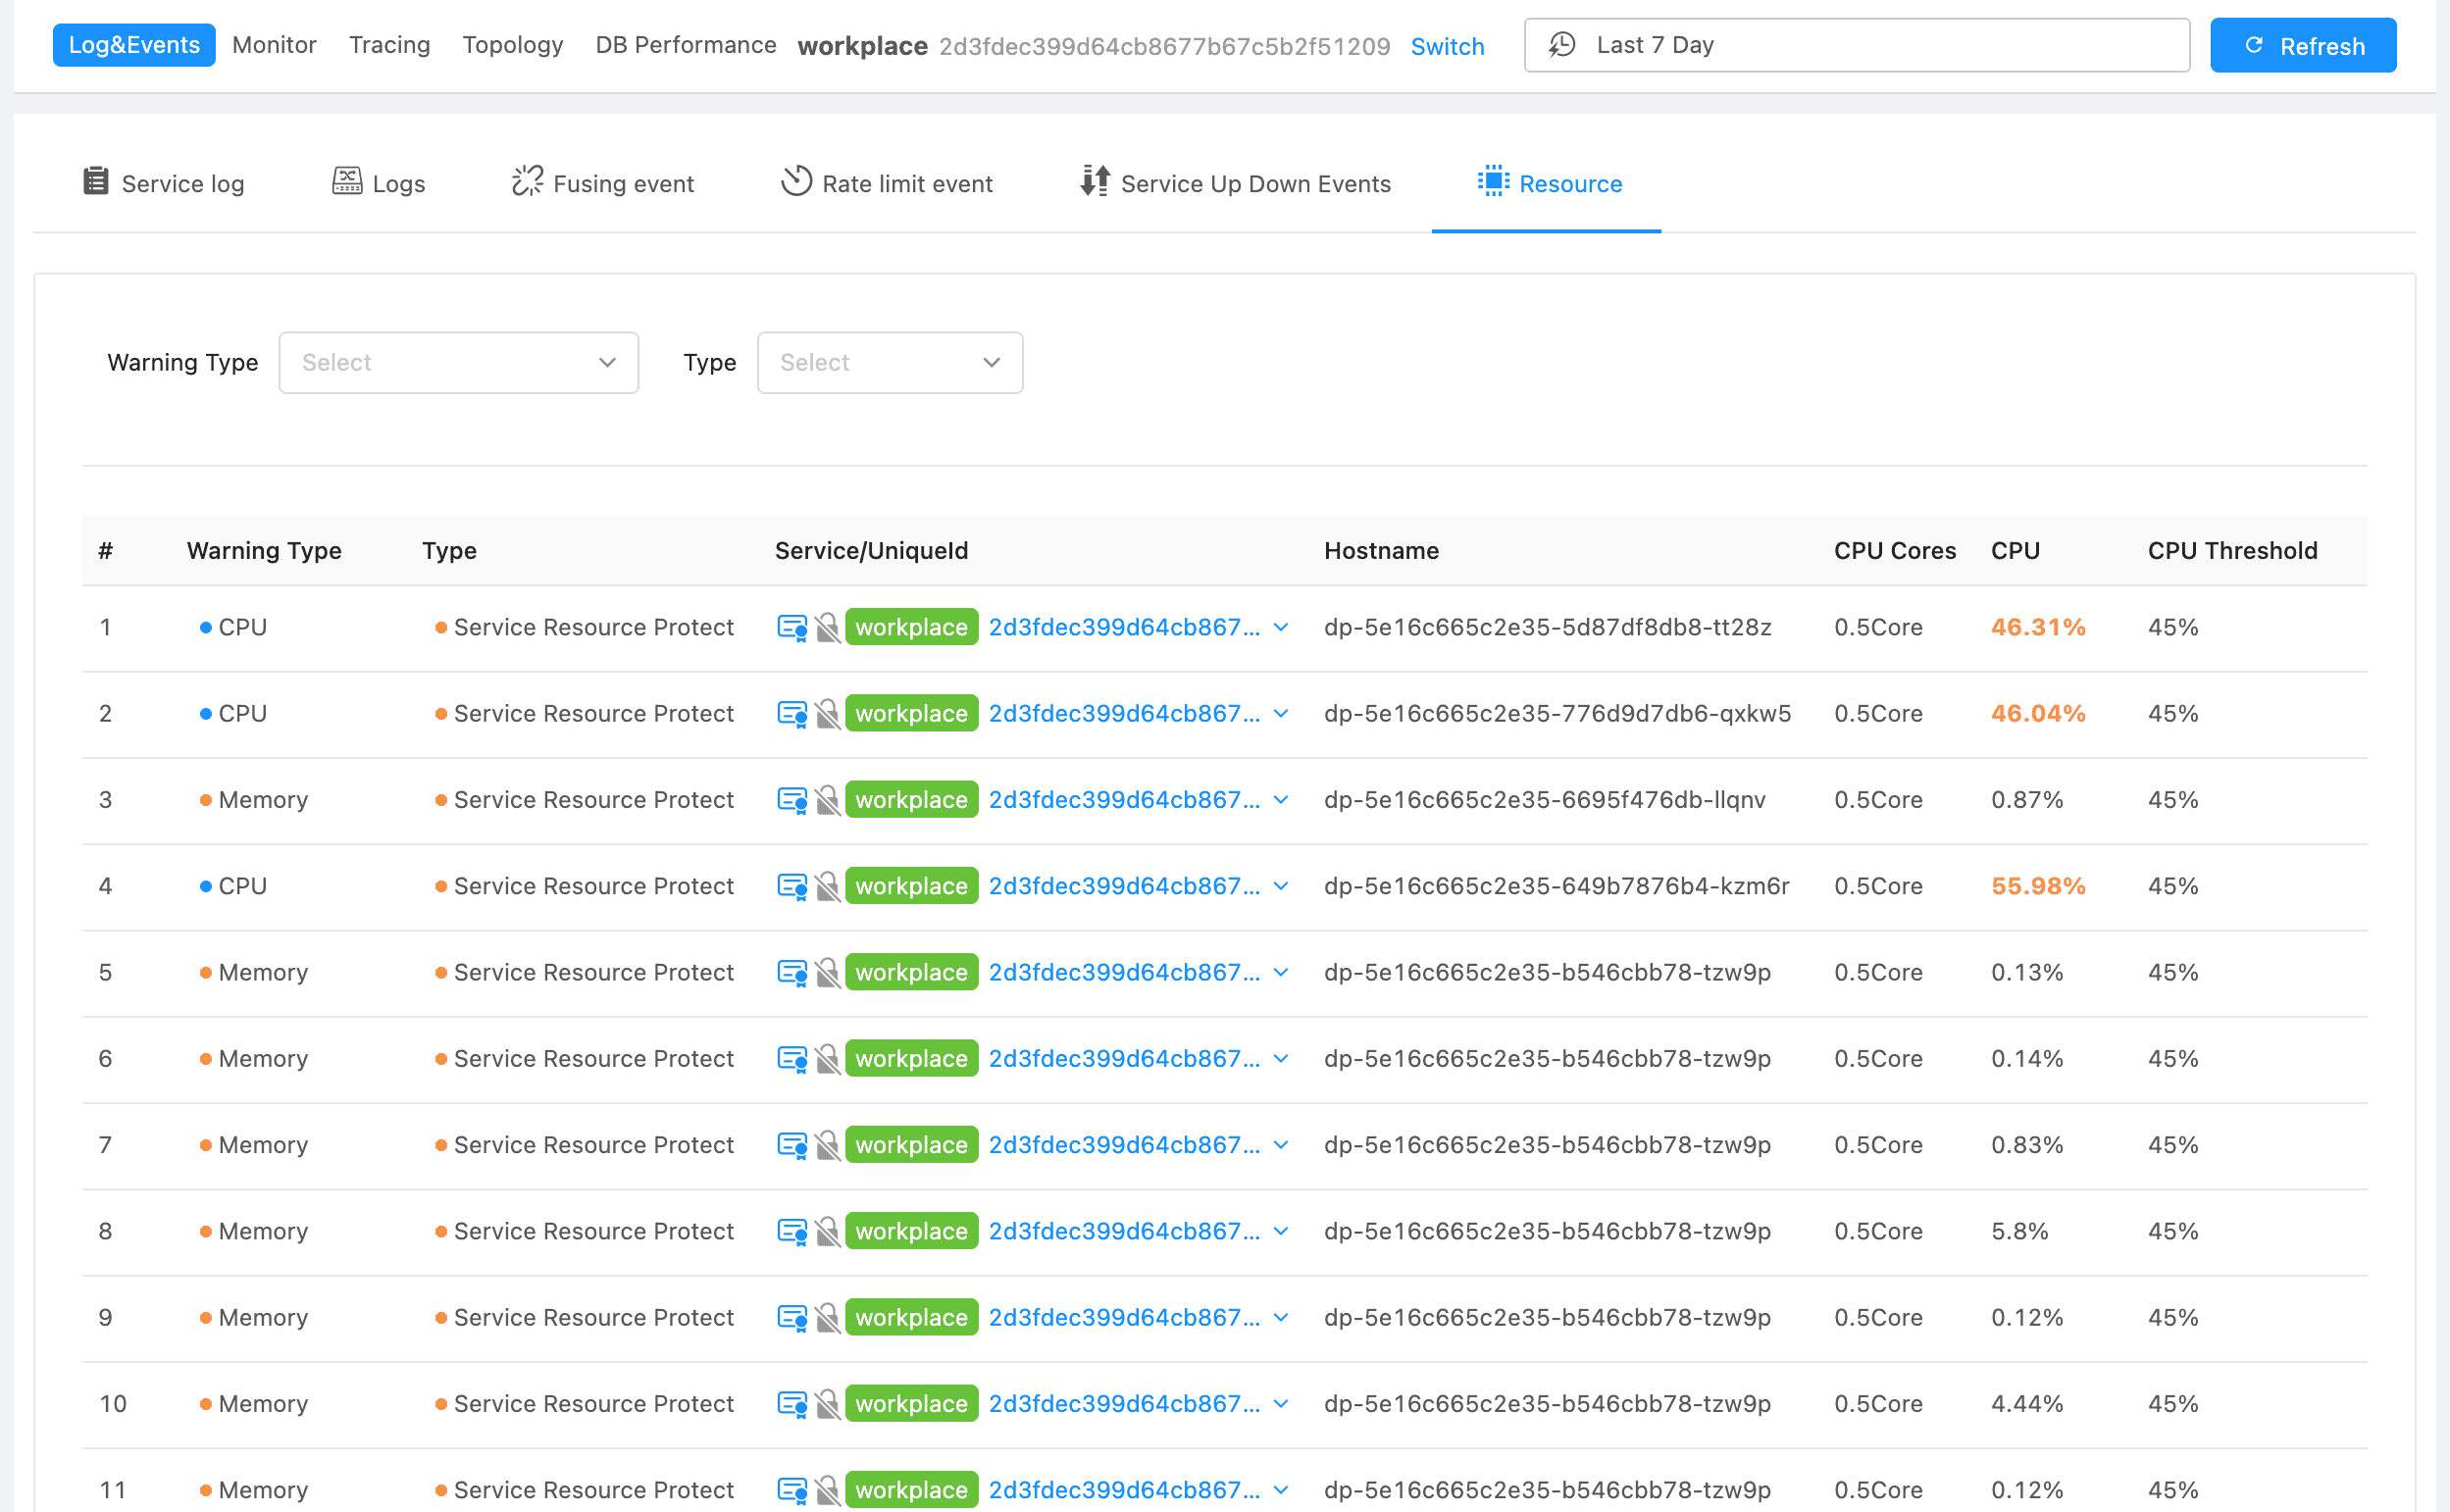
Resource Events #
Service Metrics #
Resource Usage Trend #
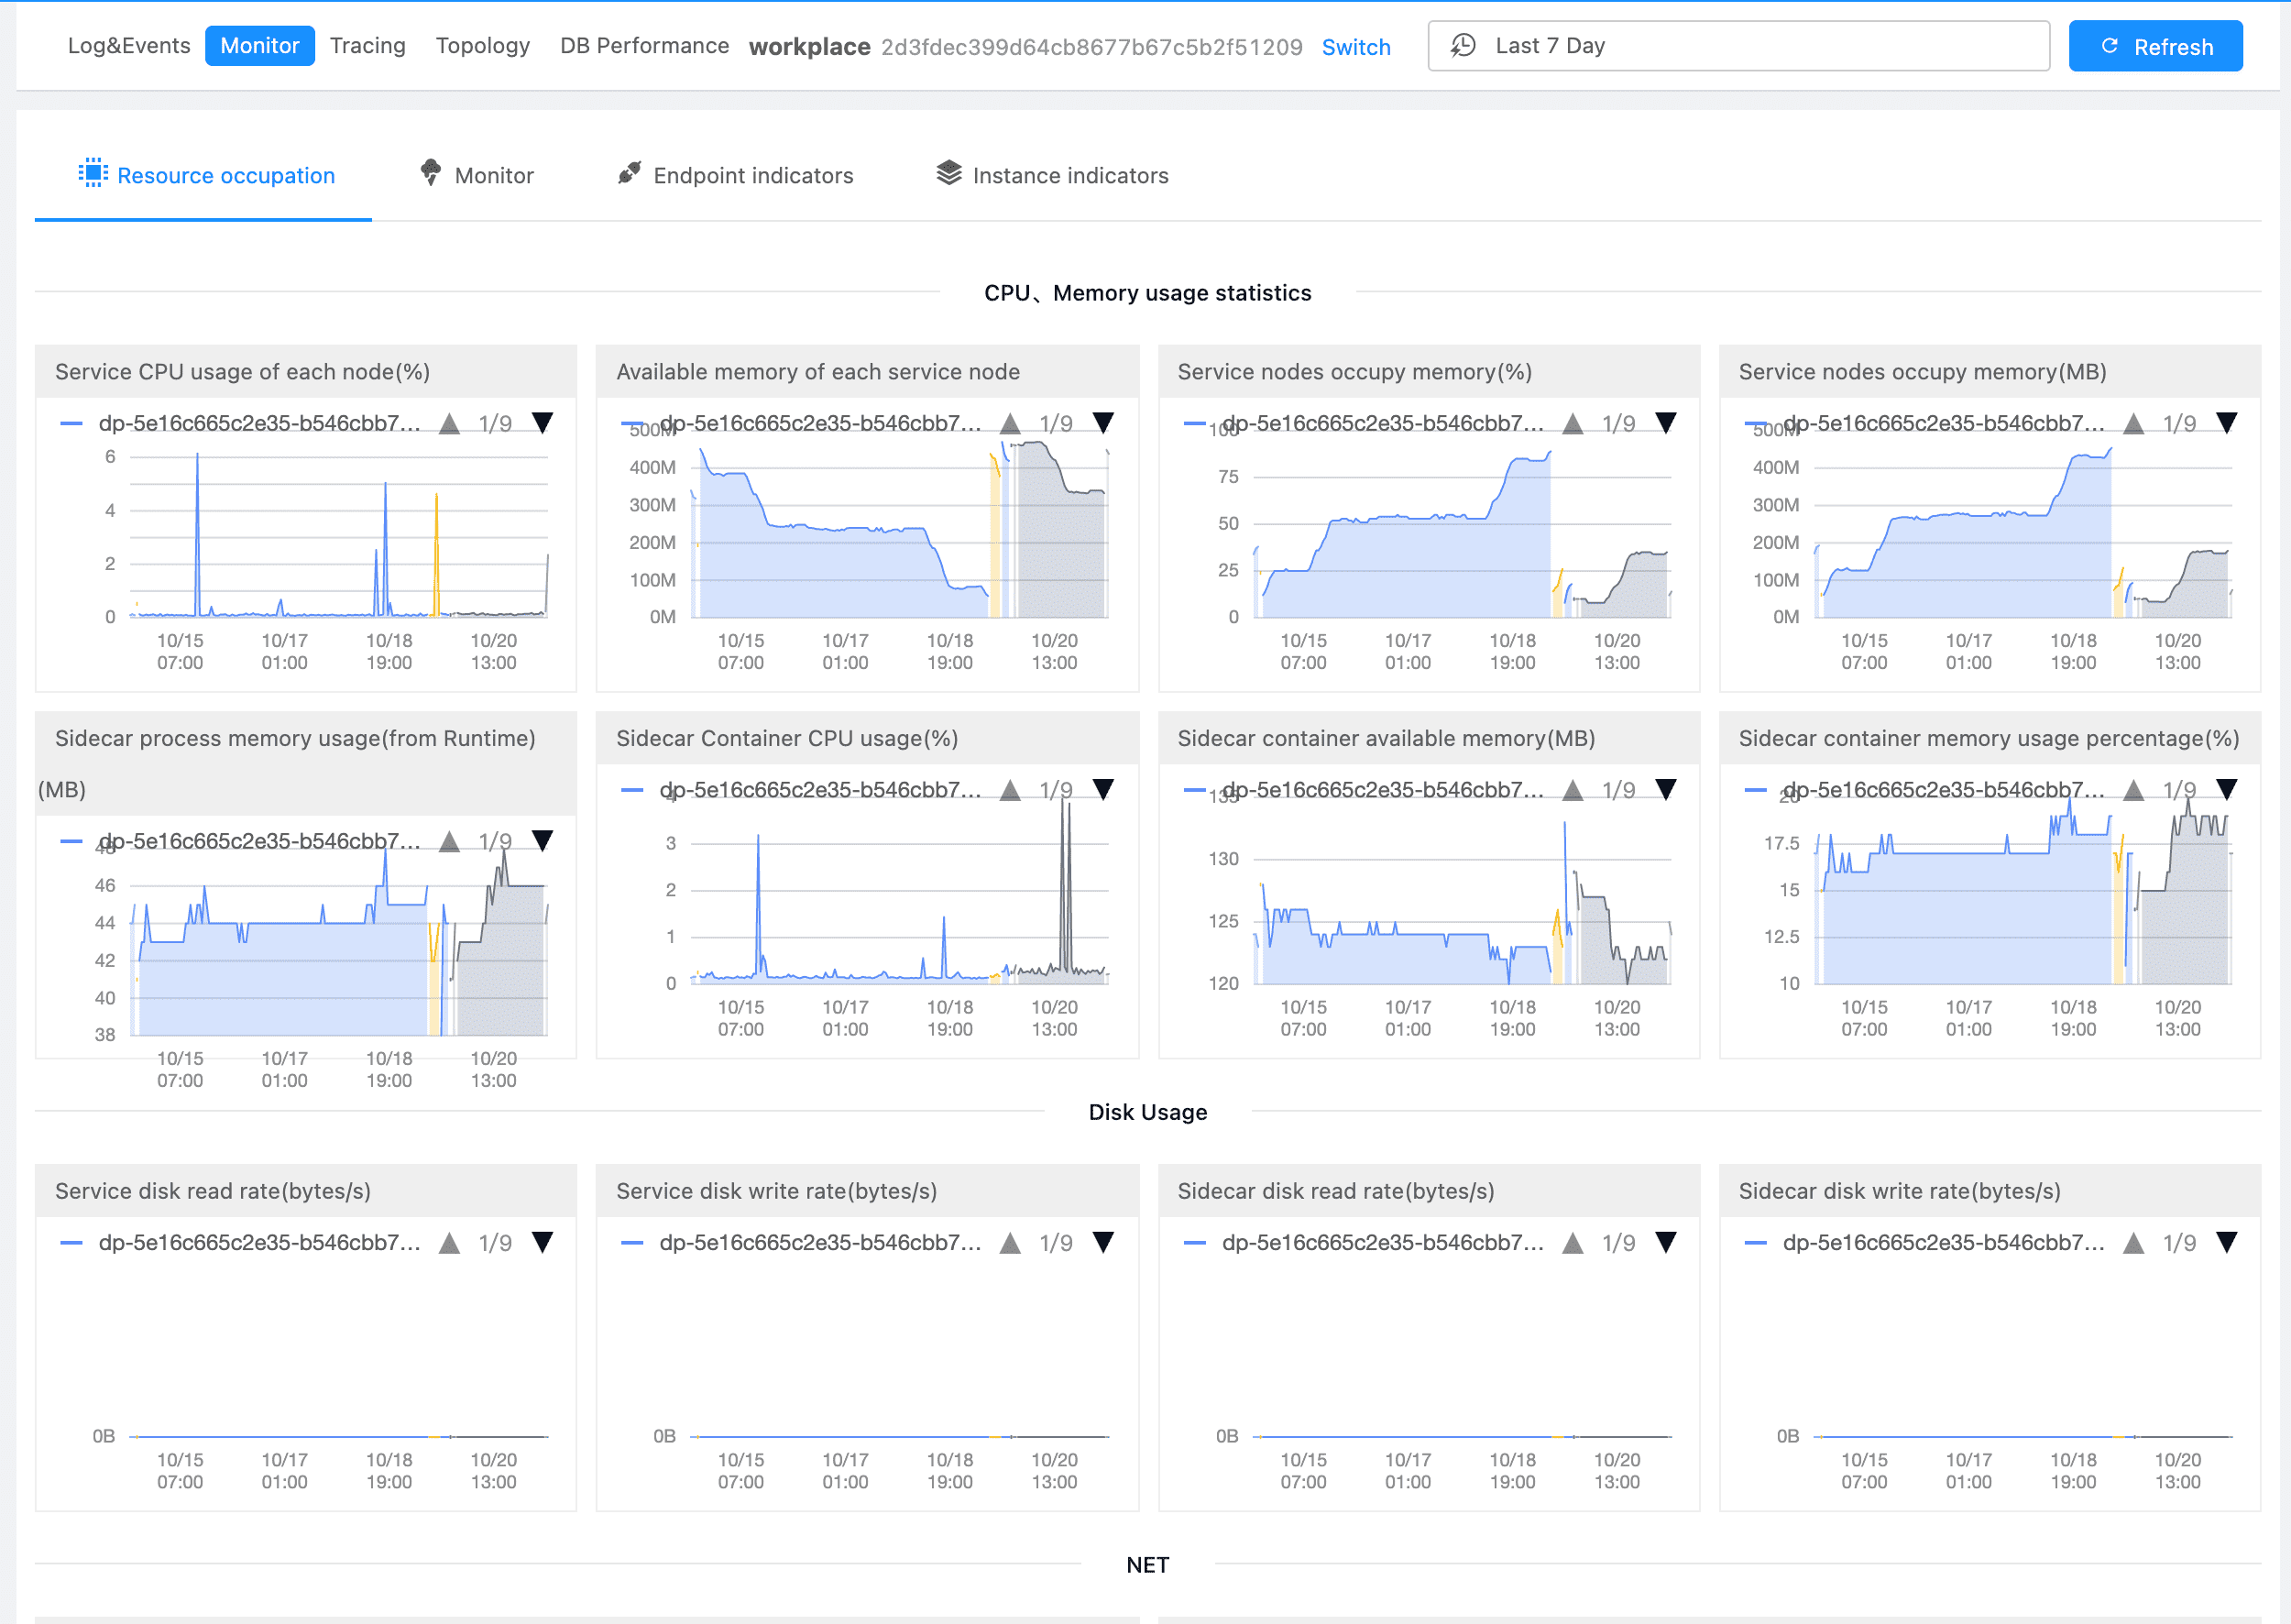
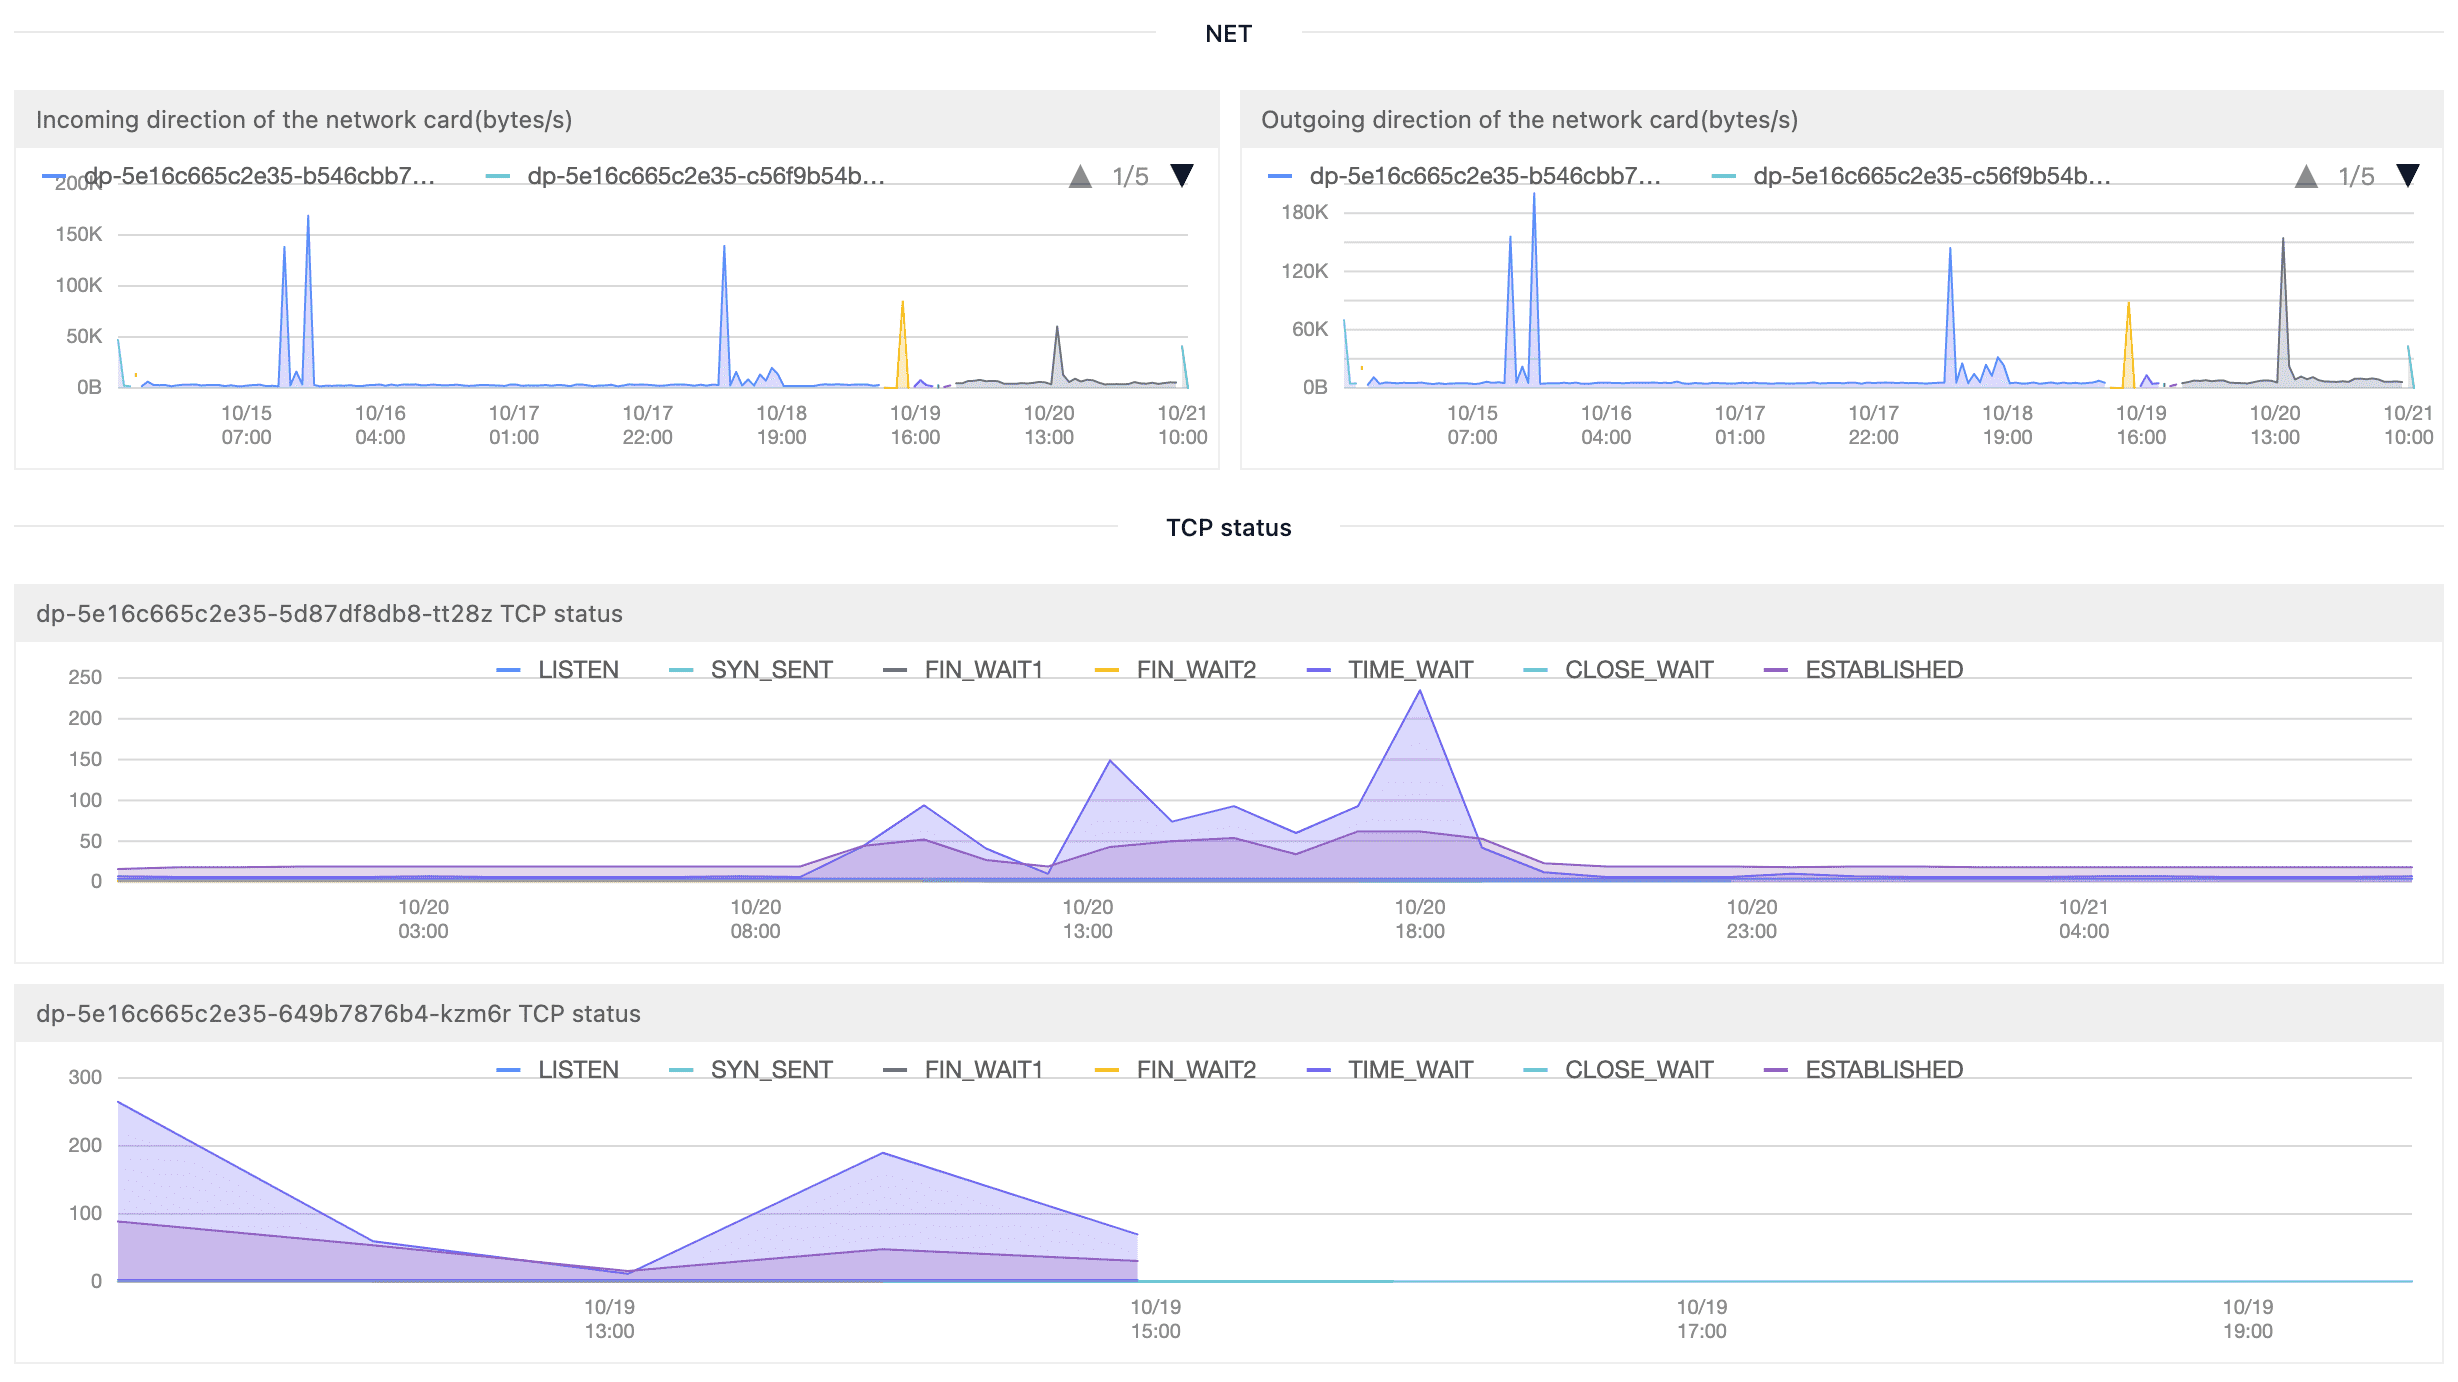
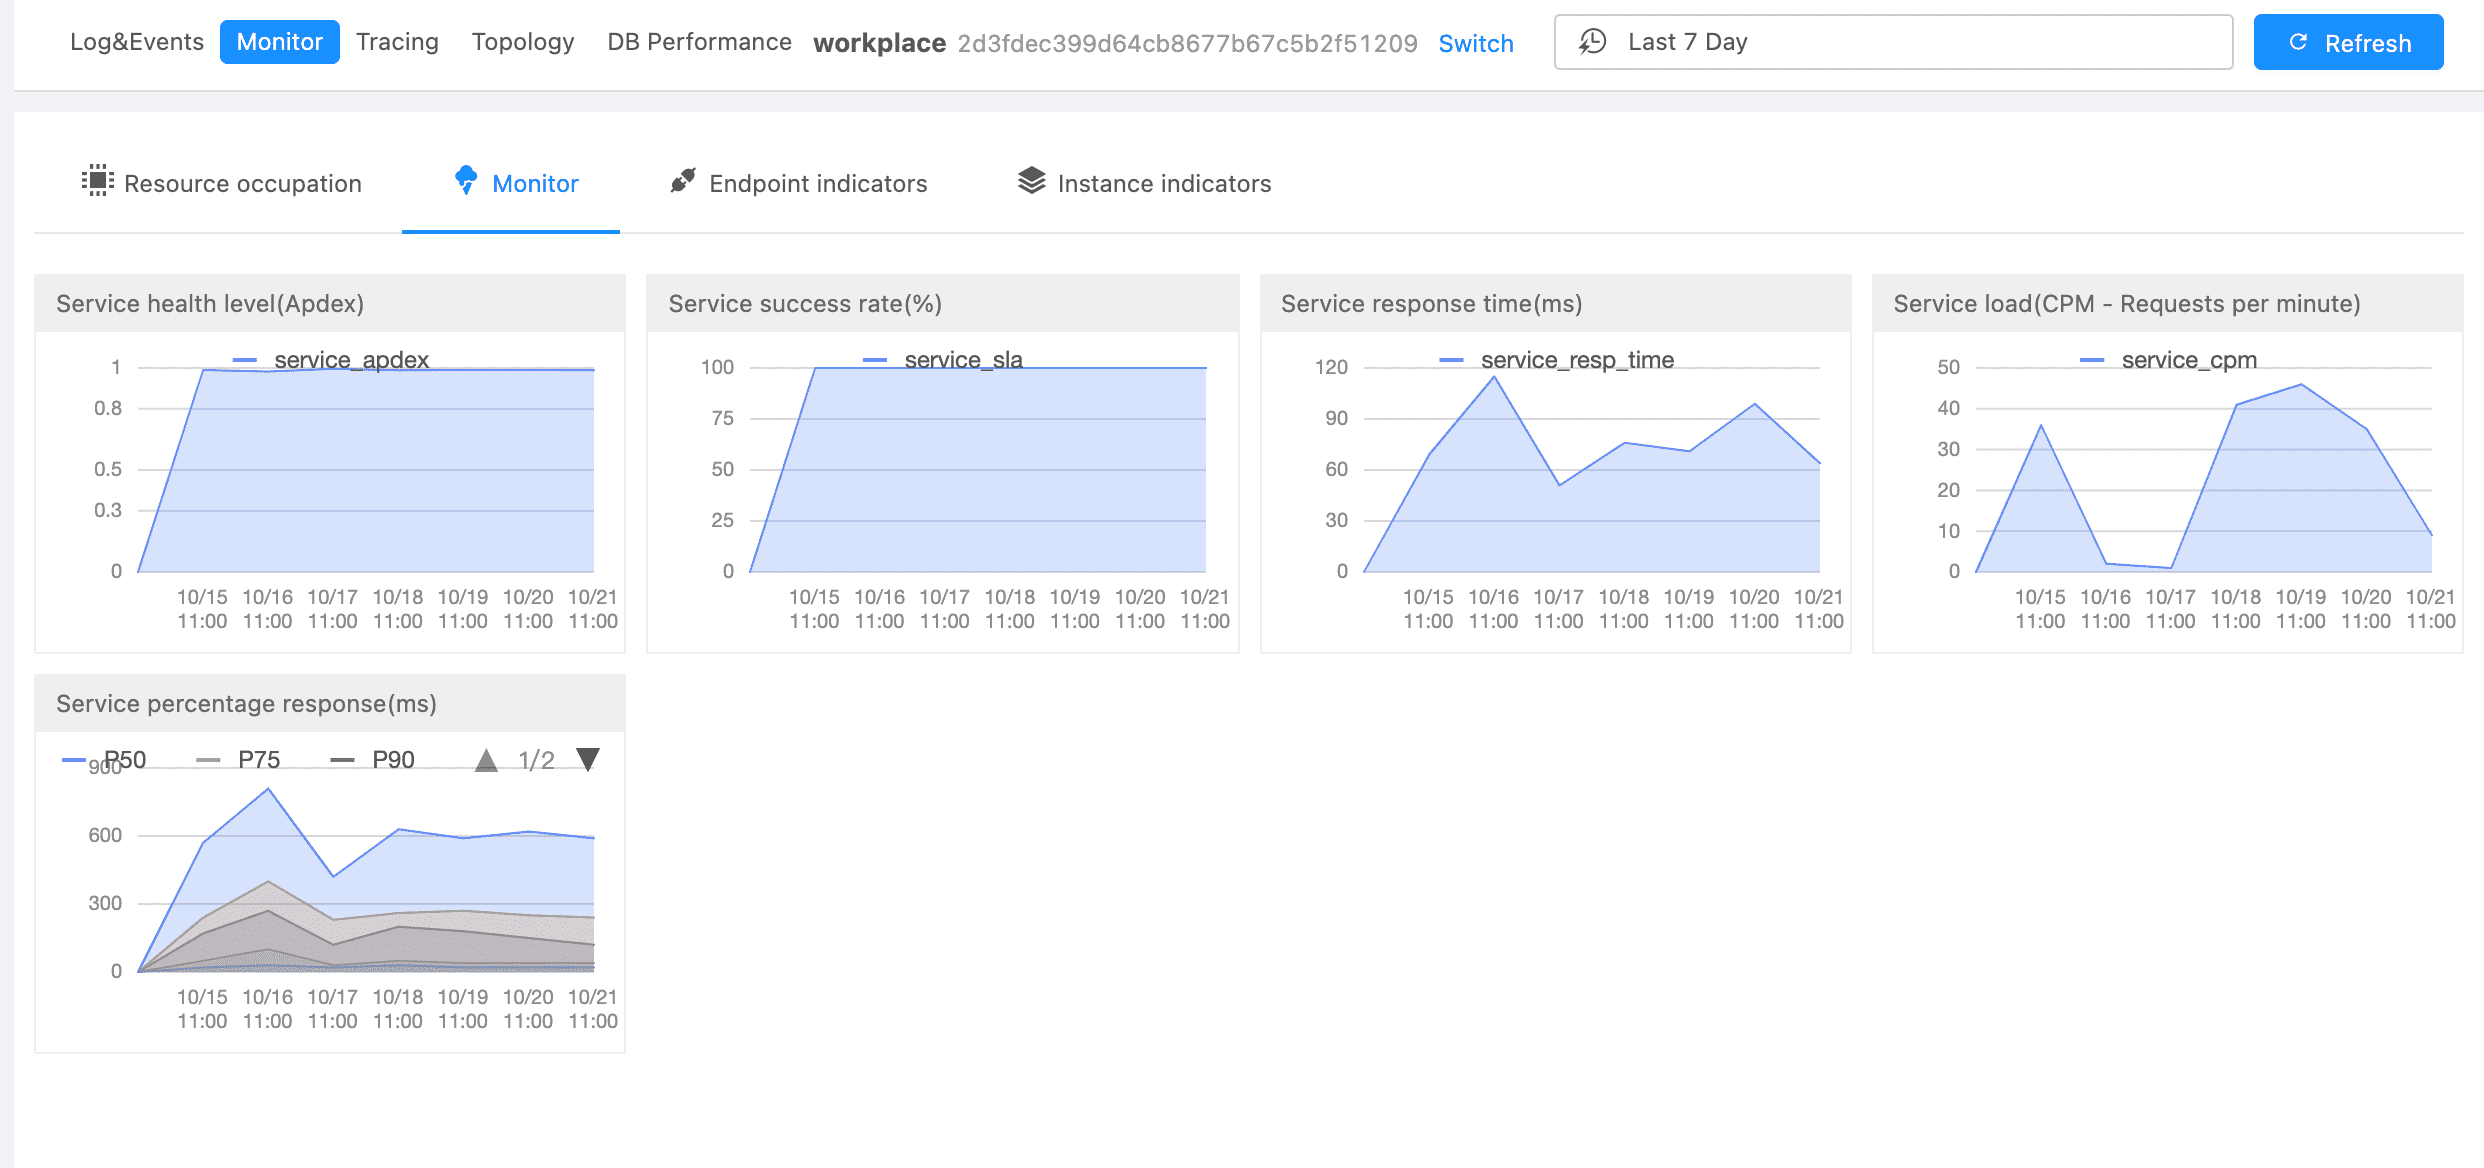
Service Metrics #
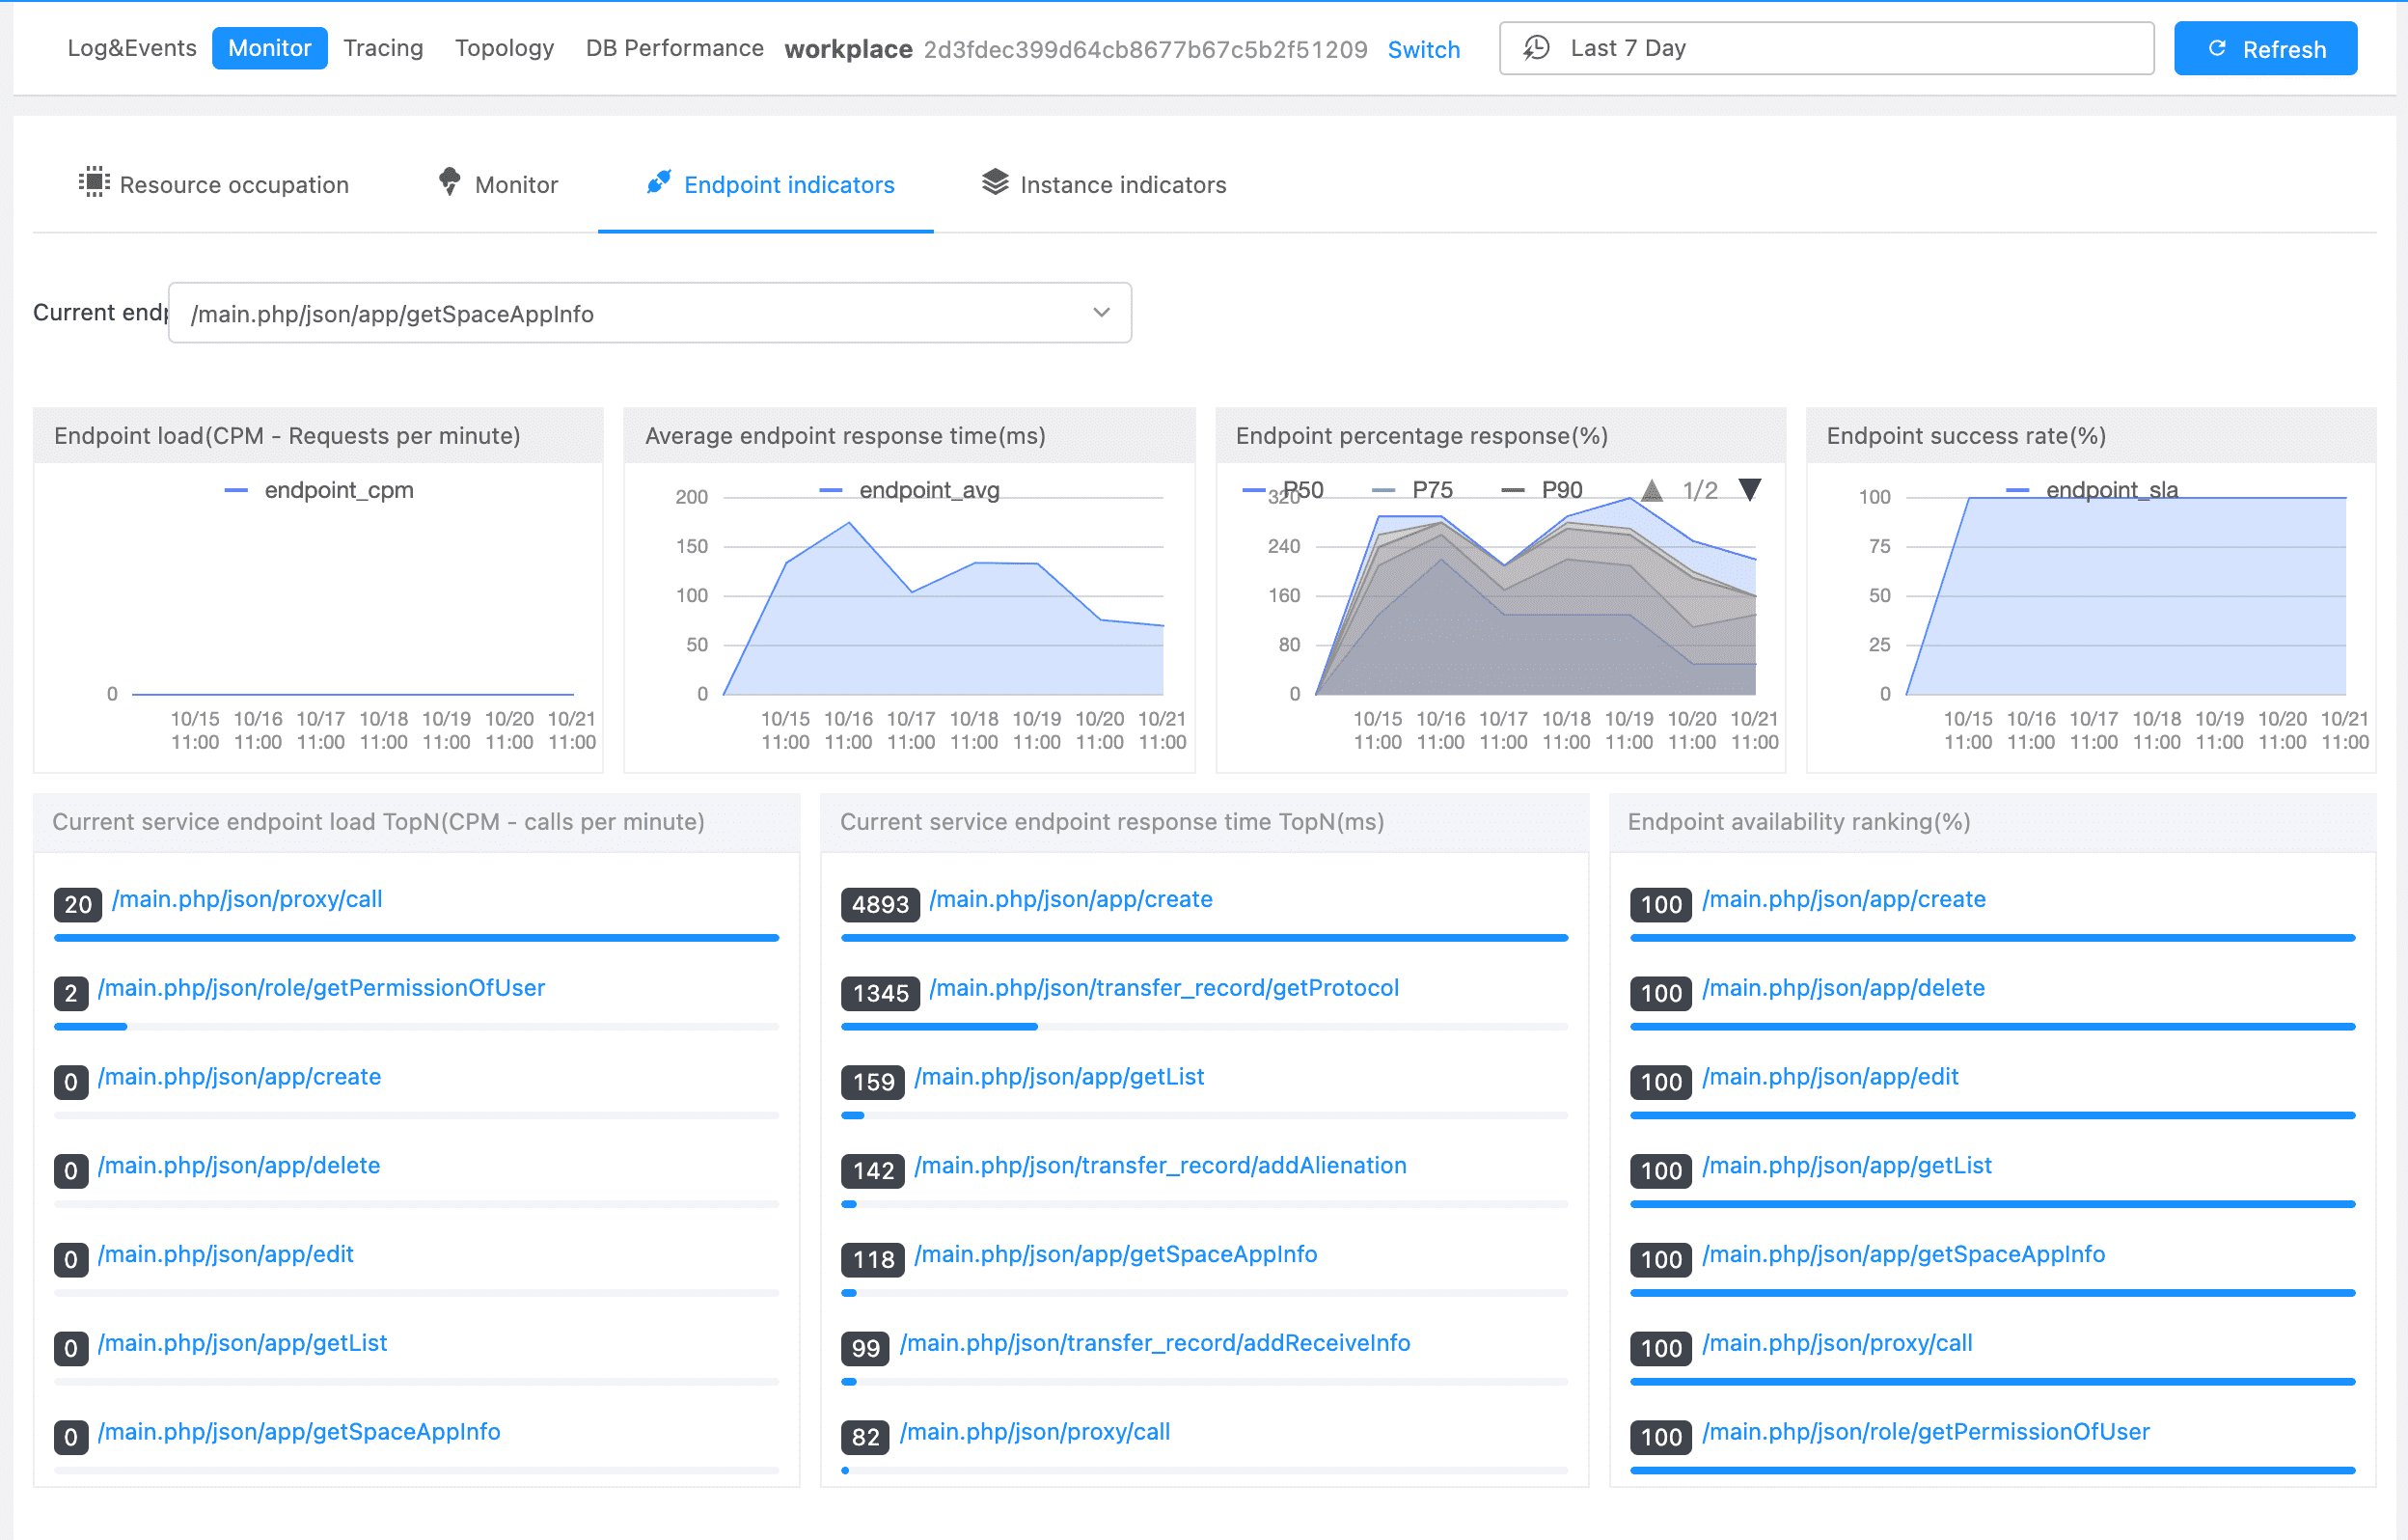
Endpoint Metrics #
Instance Metrics #
Traces #
Topology #
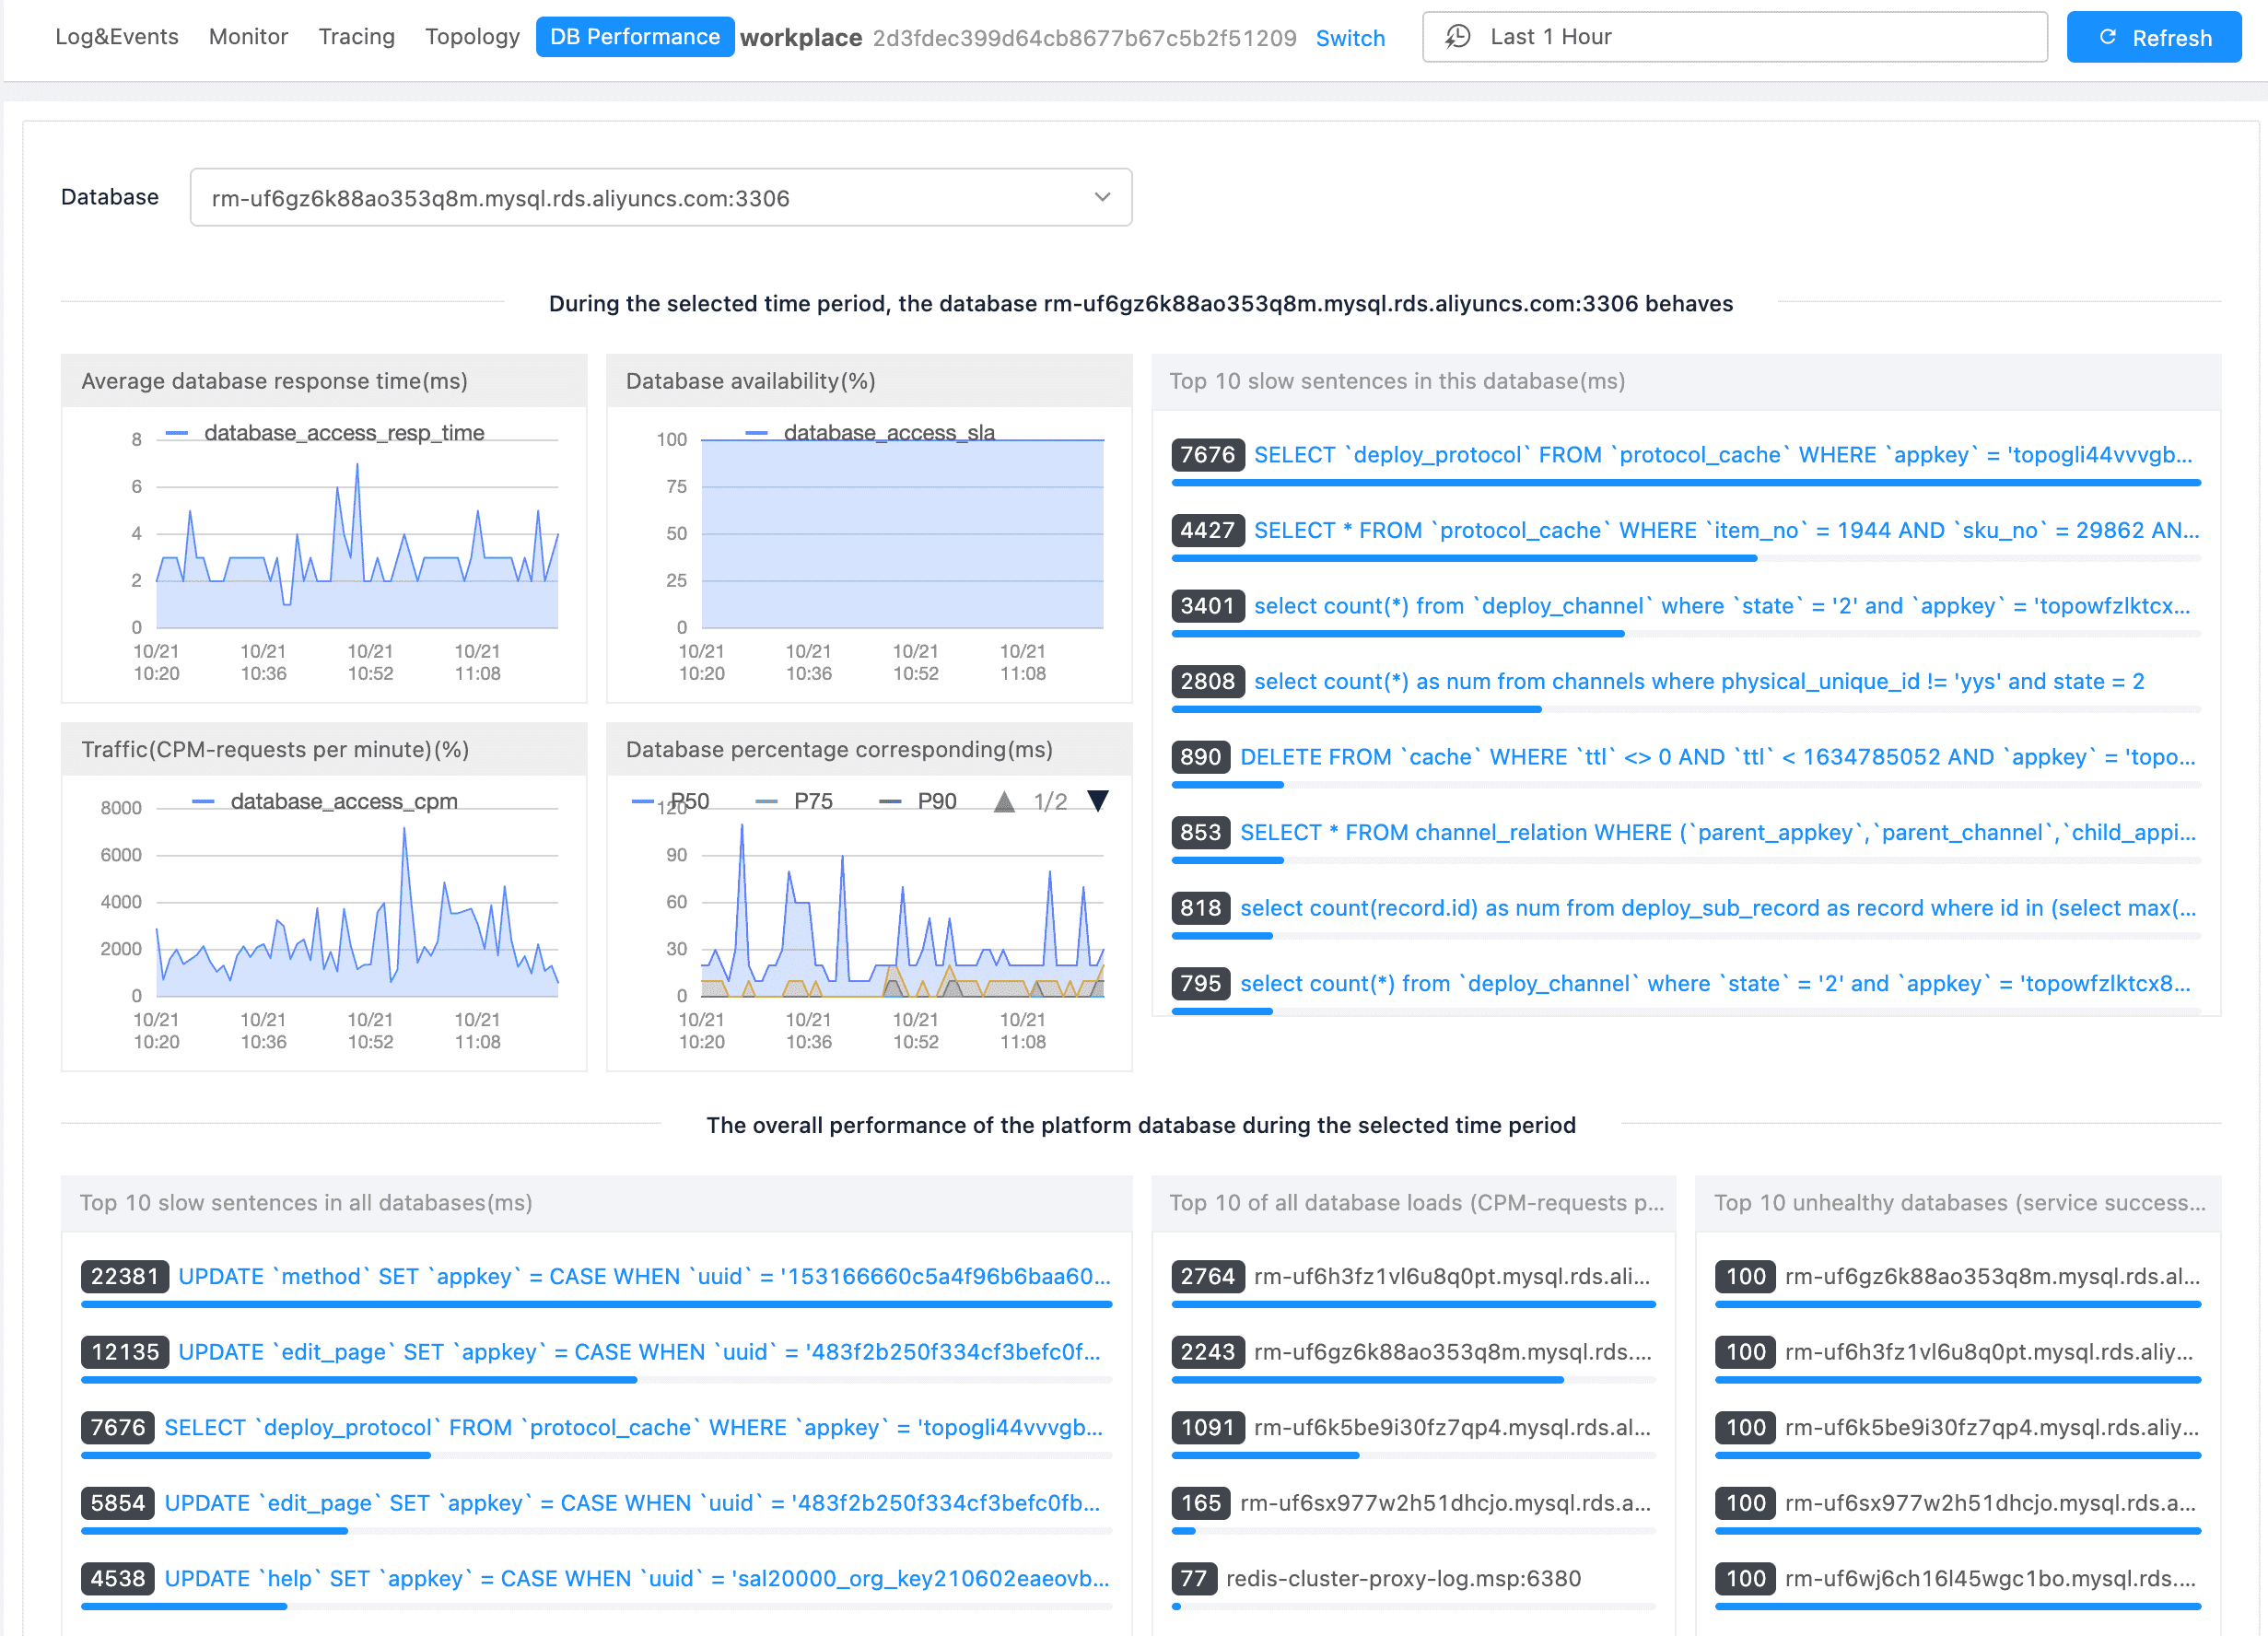
DB Performance #
In the “DB Performance” module, you can view the overall database performance of the platform, or the performance of a specified database.