Engine Details #
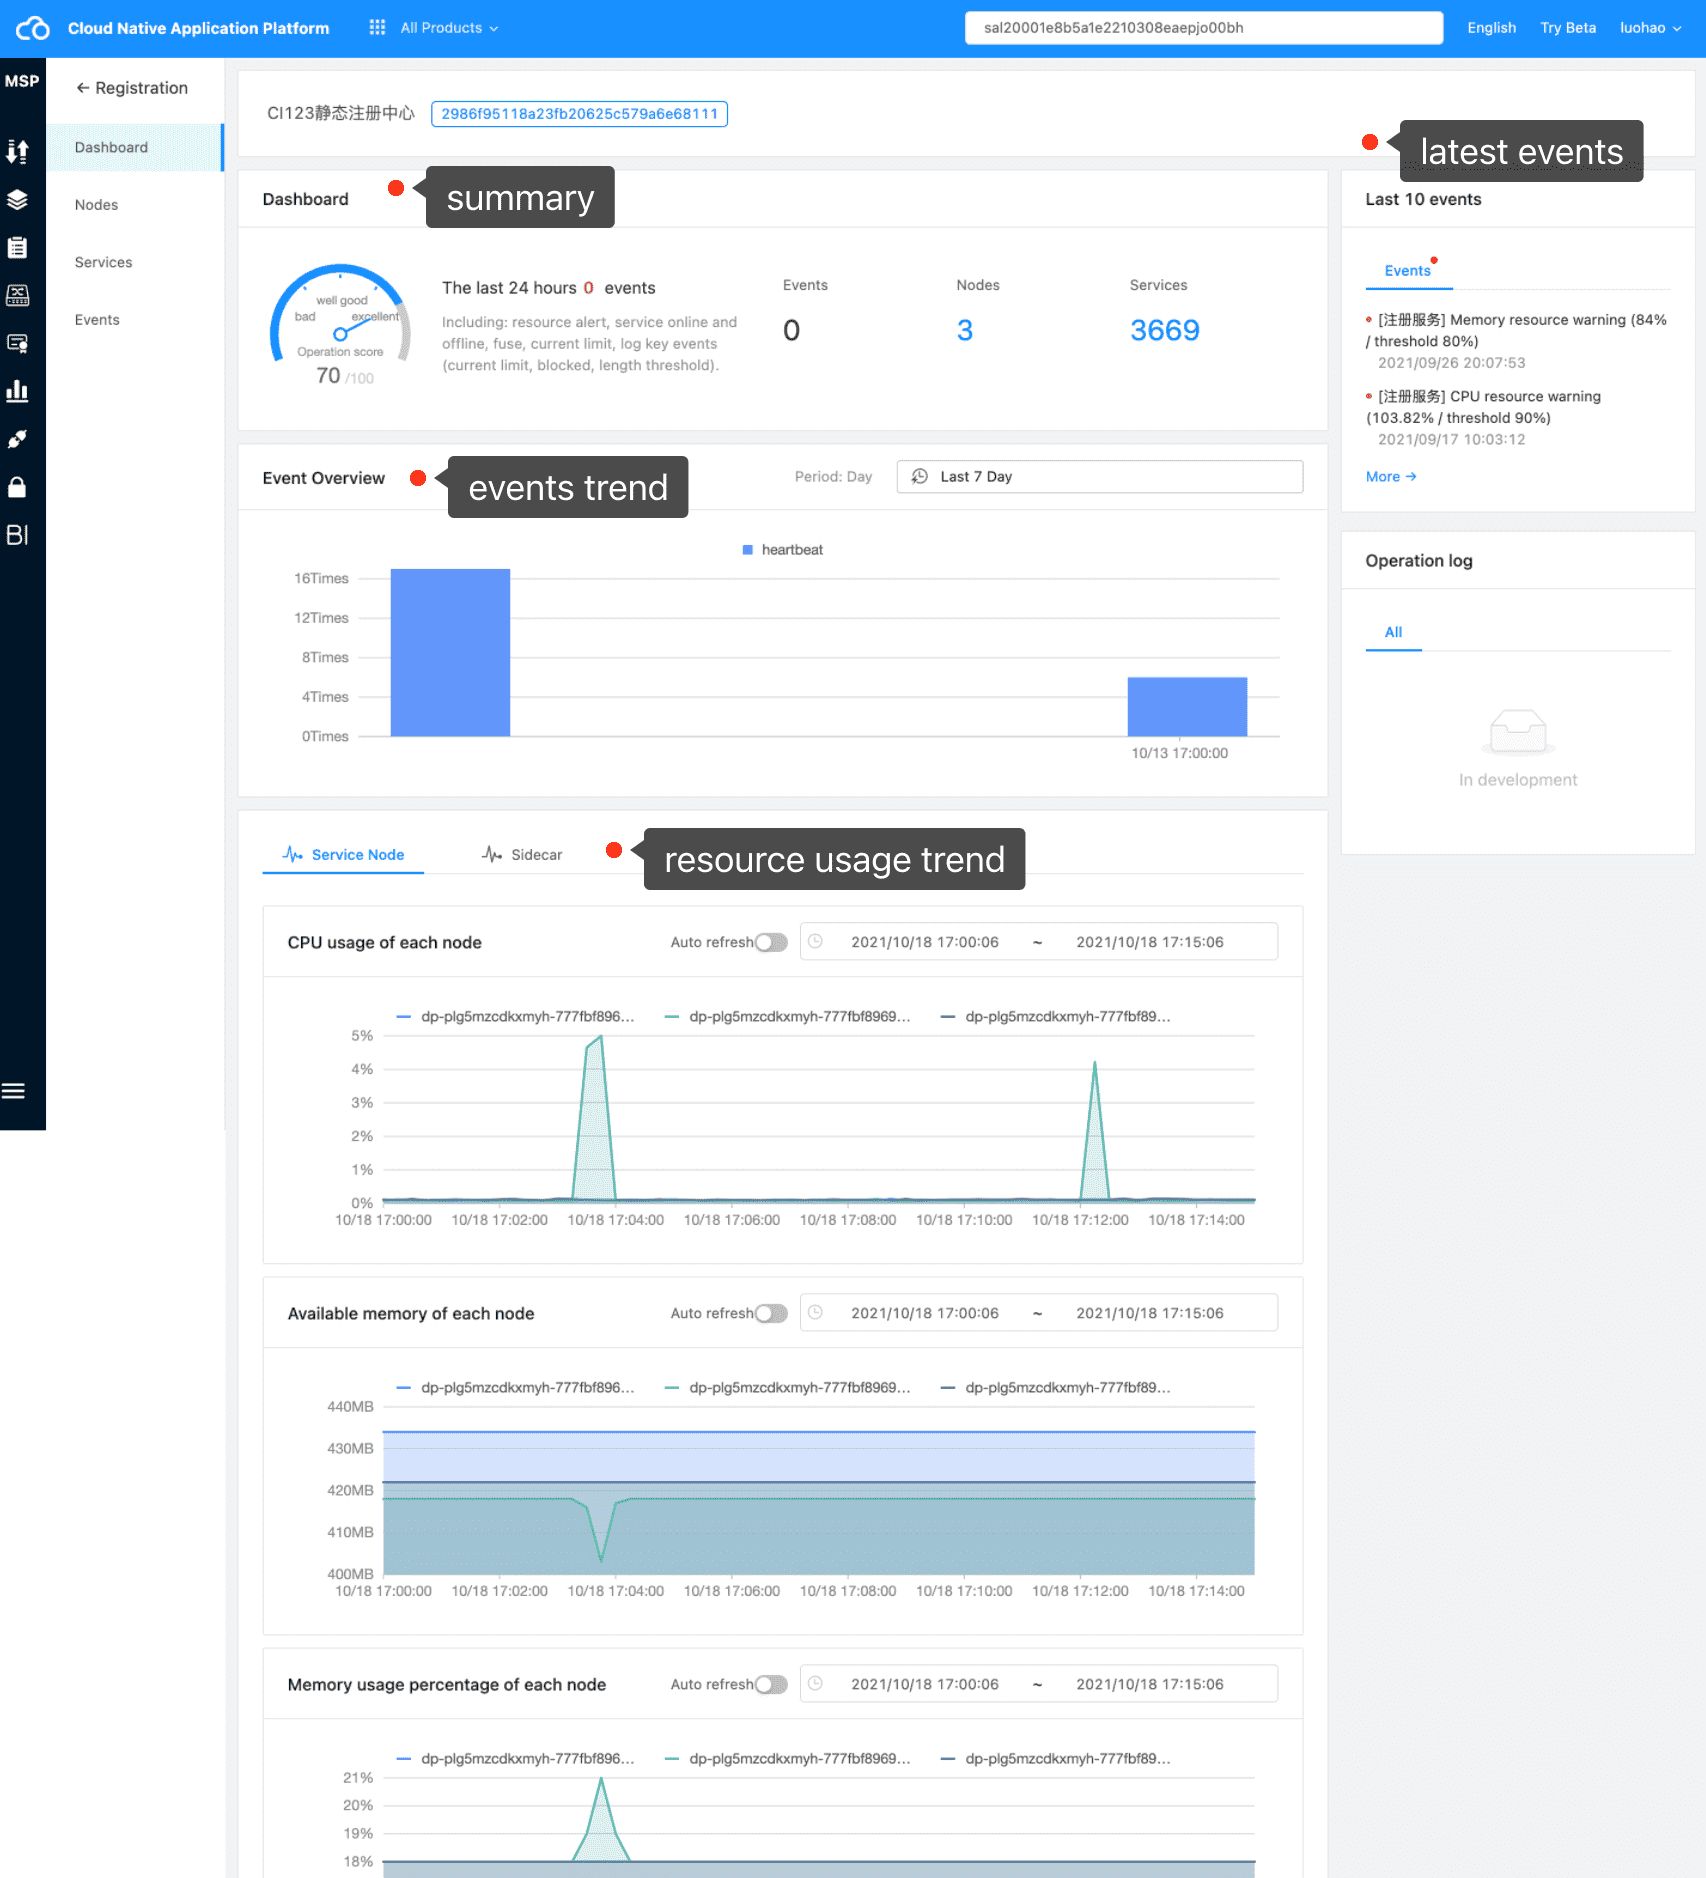
Through the engine details, you can see more information about the engine, including:
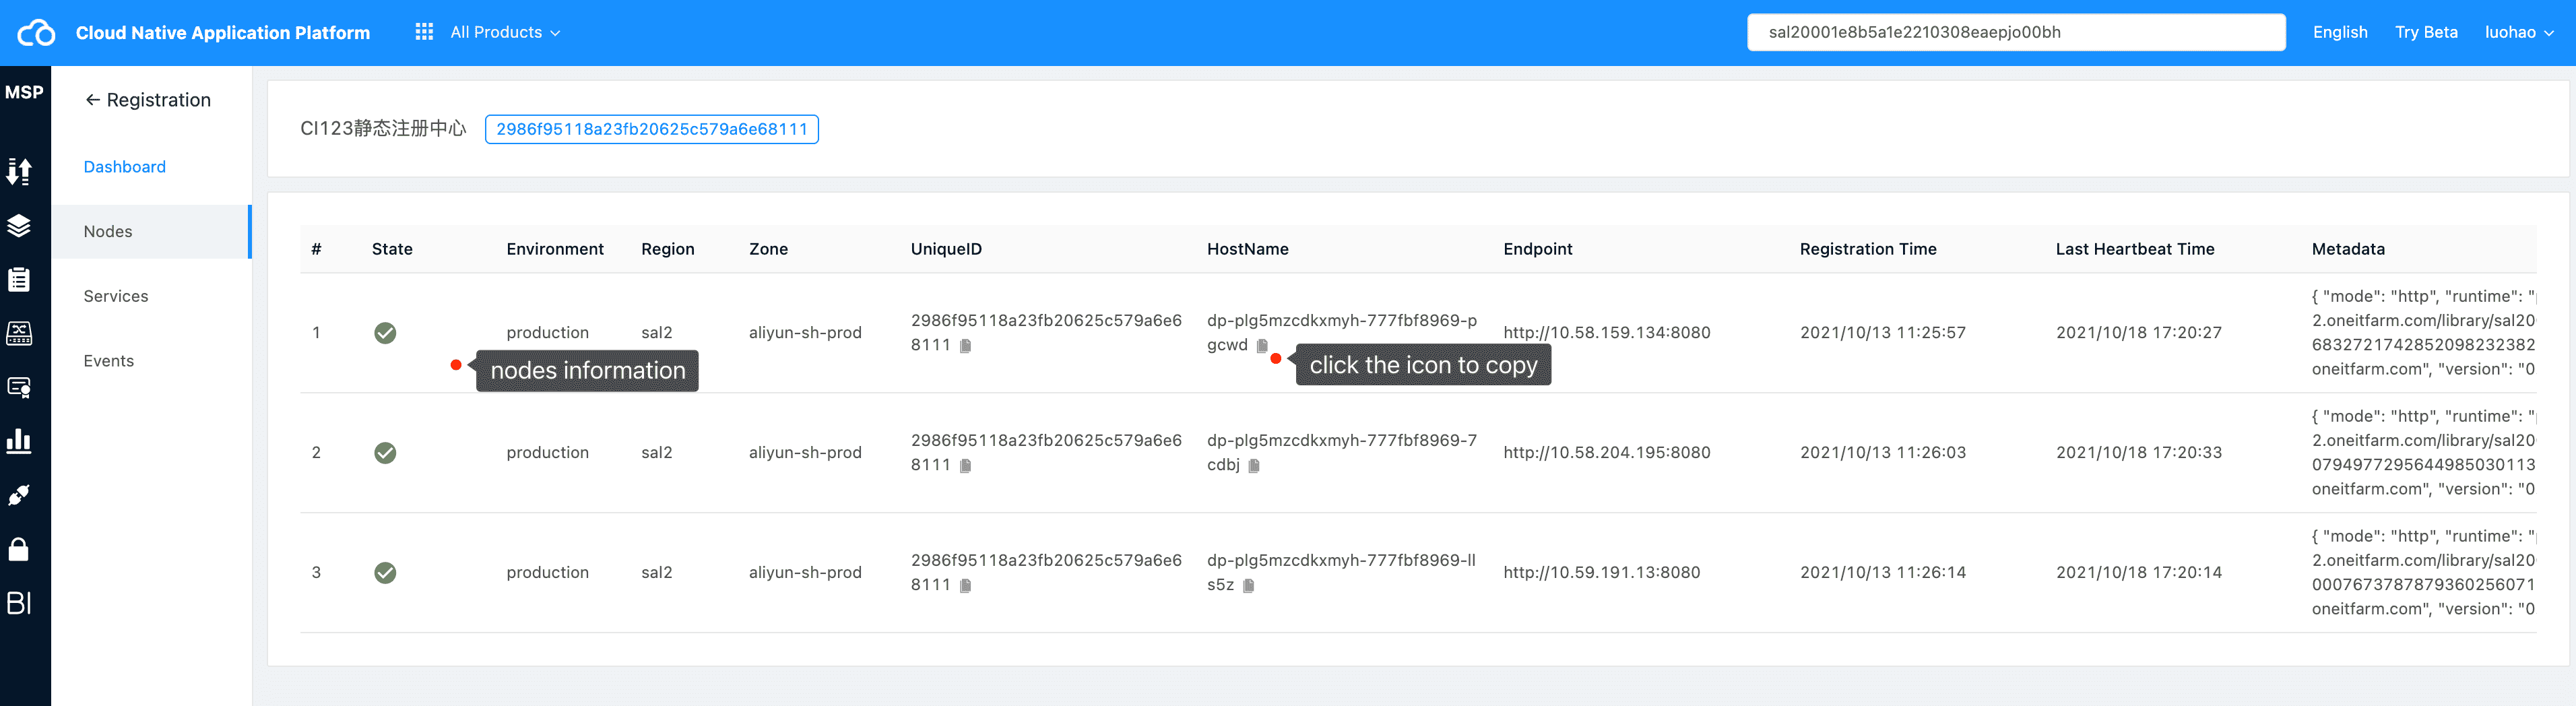
- The resource information owned by the engine includes nodes and services.
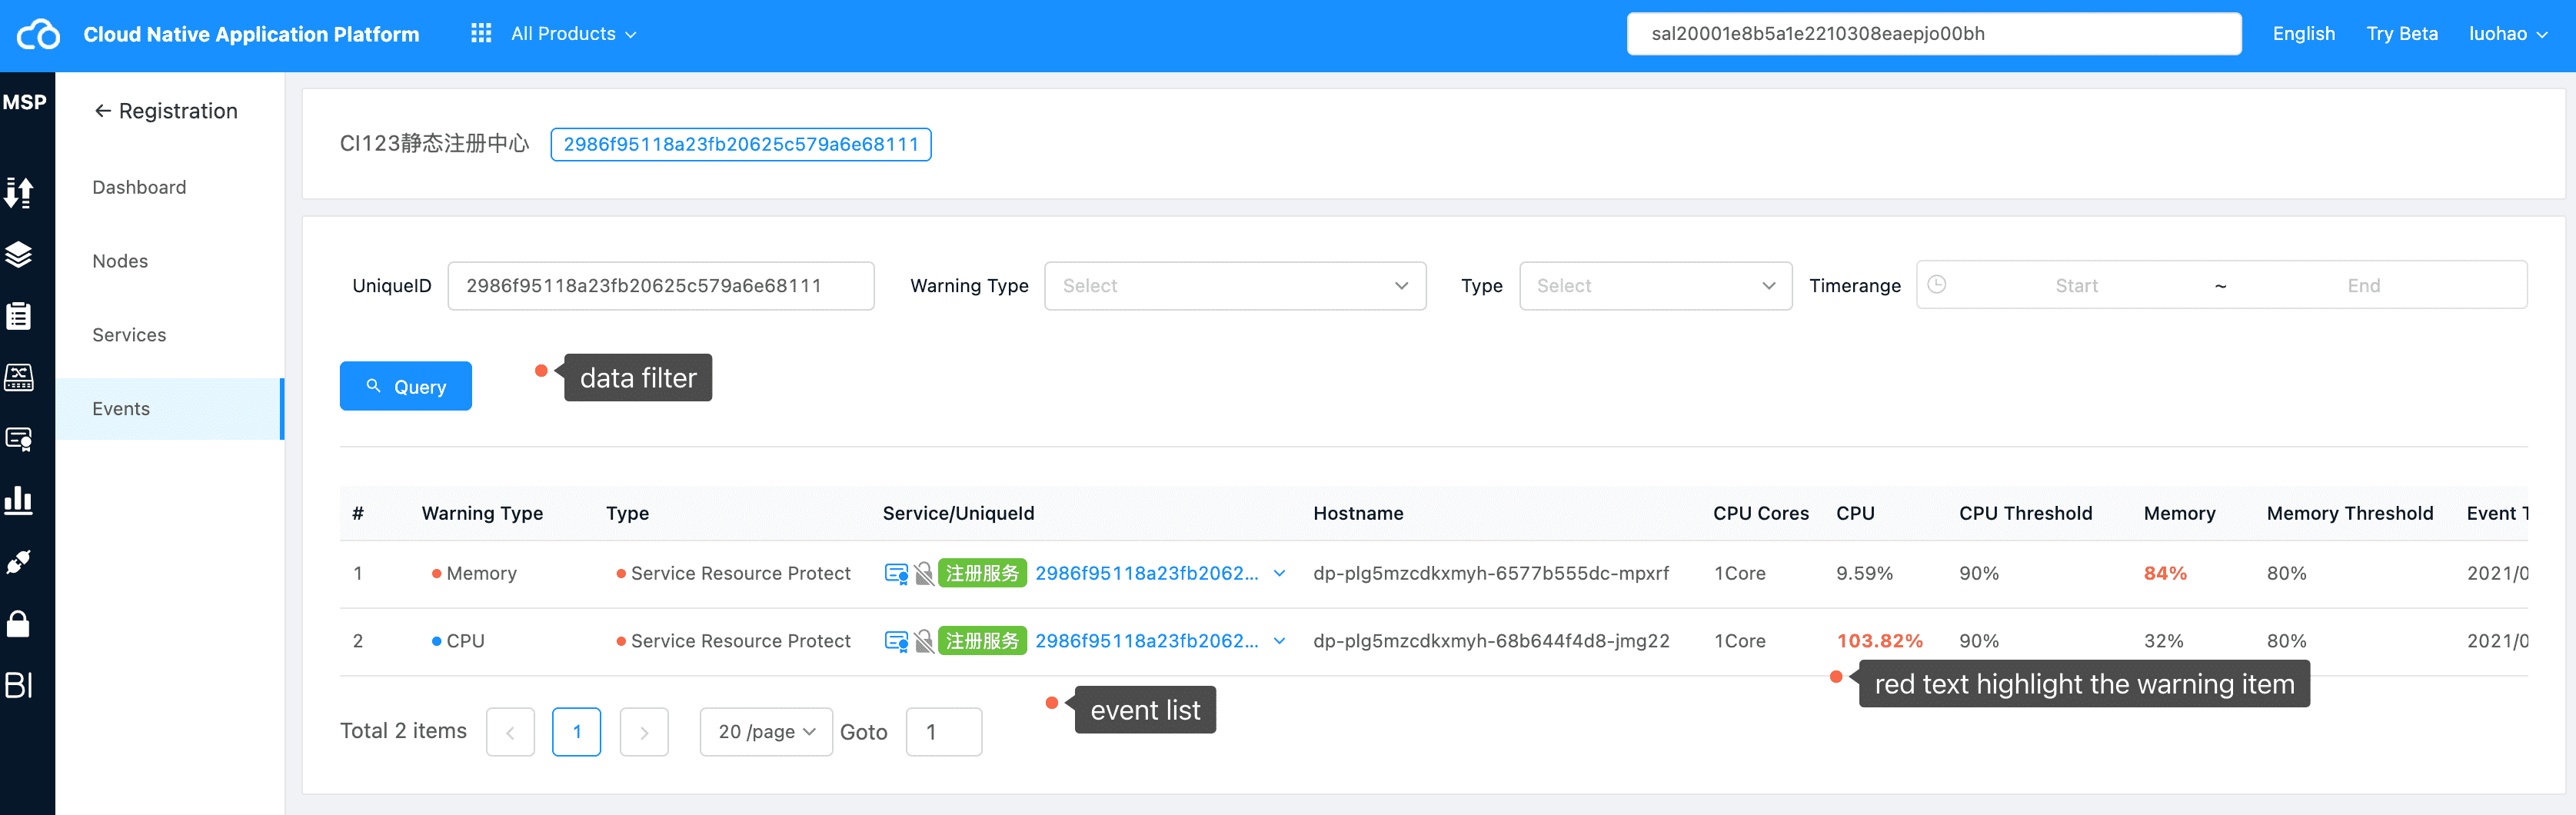
- The current event overview and details of the engine.
- The current running status of the engine, including: node resource (CPU, memory) usage trend and sidecar resource (CPU, memory) usage trend.
Dashboard #
Dashboard Card #
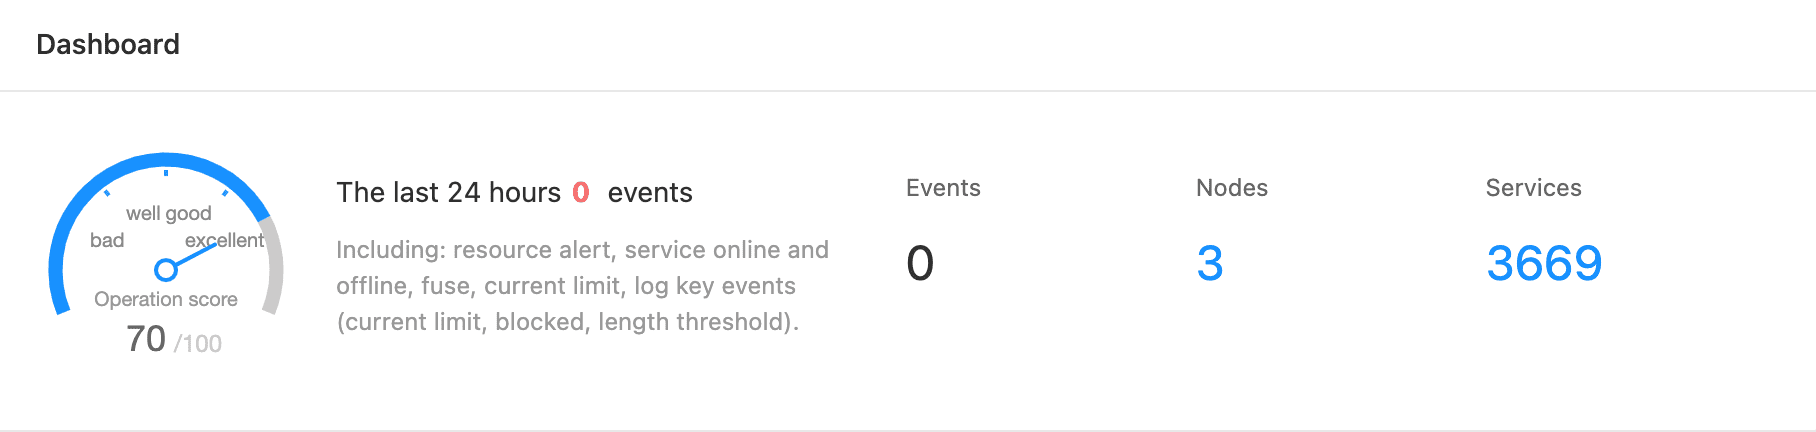
This module summarizes the latest events of the current engine, the number of included engine nodes and the number of registered services. Through this module, we can have a macro understanding of the resources and events of the engine.
You can view more details by clicking on the specific number of events, nodes or services.
Event Overview Card #
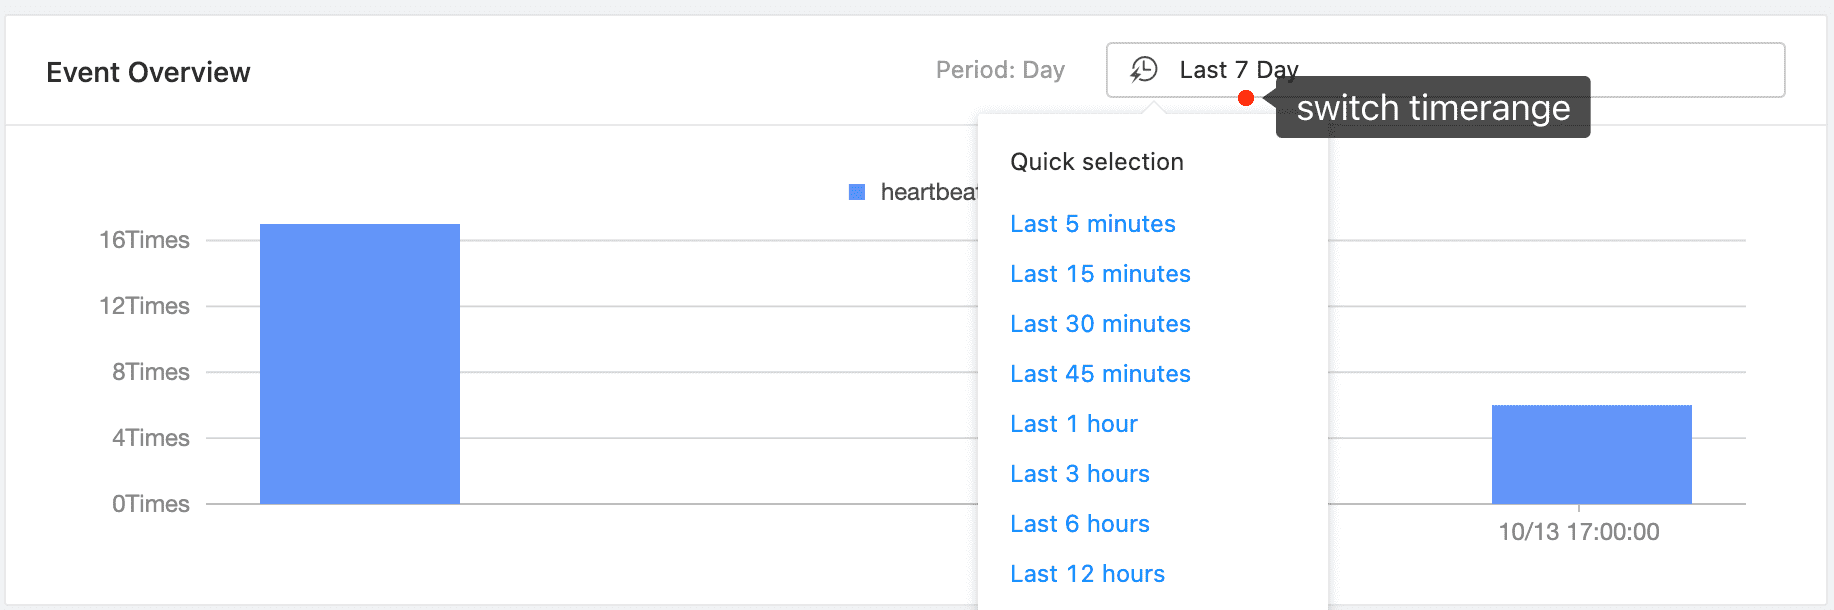
The module summarizes the trigger trend of events according to the selected time range. Through this module, we can clearly see the trend triggered by events, and then analyze potential problems. For example:
- Does the event trigger have a periodic law?
- Is there any fluctuation in other modules of the system (such as resource occupation) at the time point of the event?
Resource Usage Trends Card #
Through this module, we can observe the resource usage trend of the current engine within a specified time range. Current statistics items include:
- Service node: CPU, memory
- Sidecar: process memory, container CPU, container memory
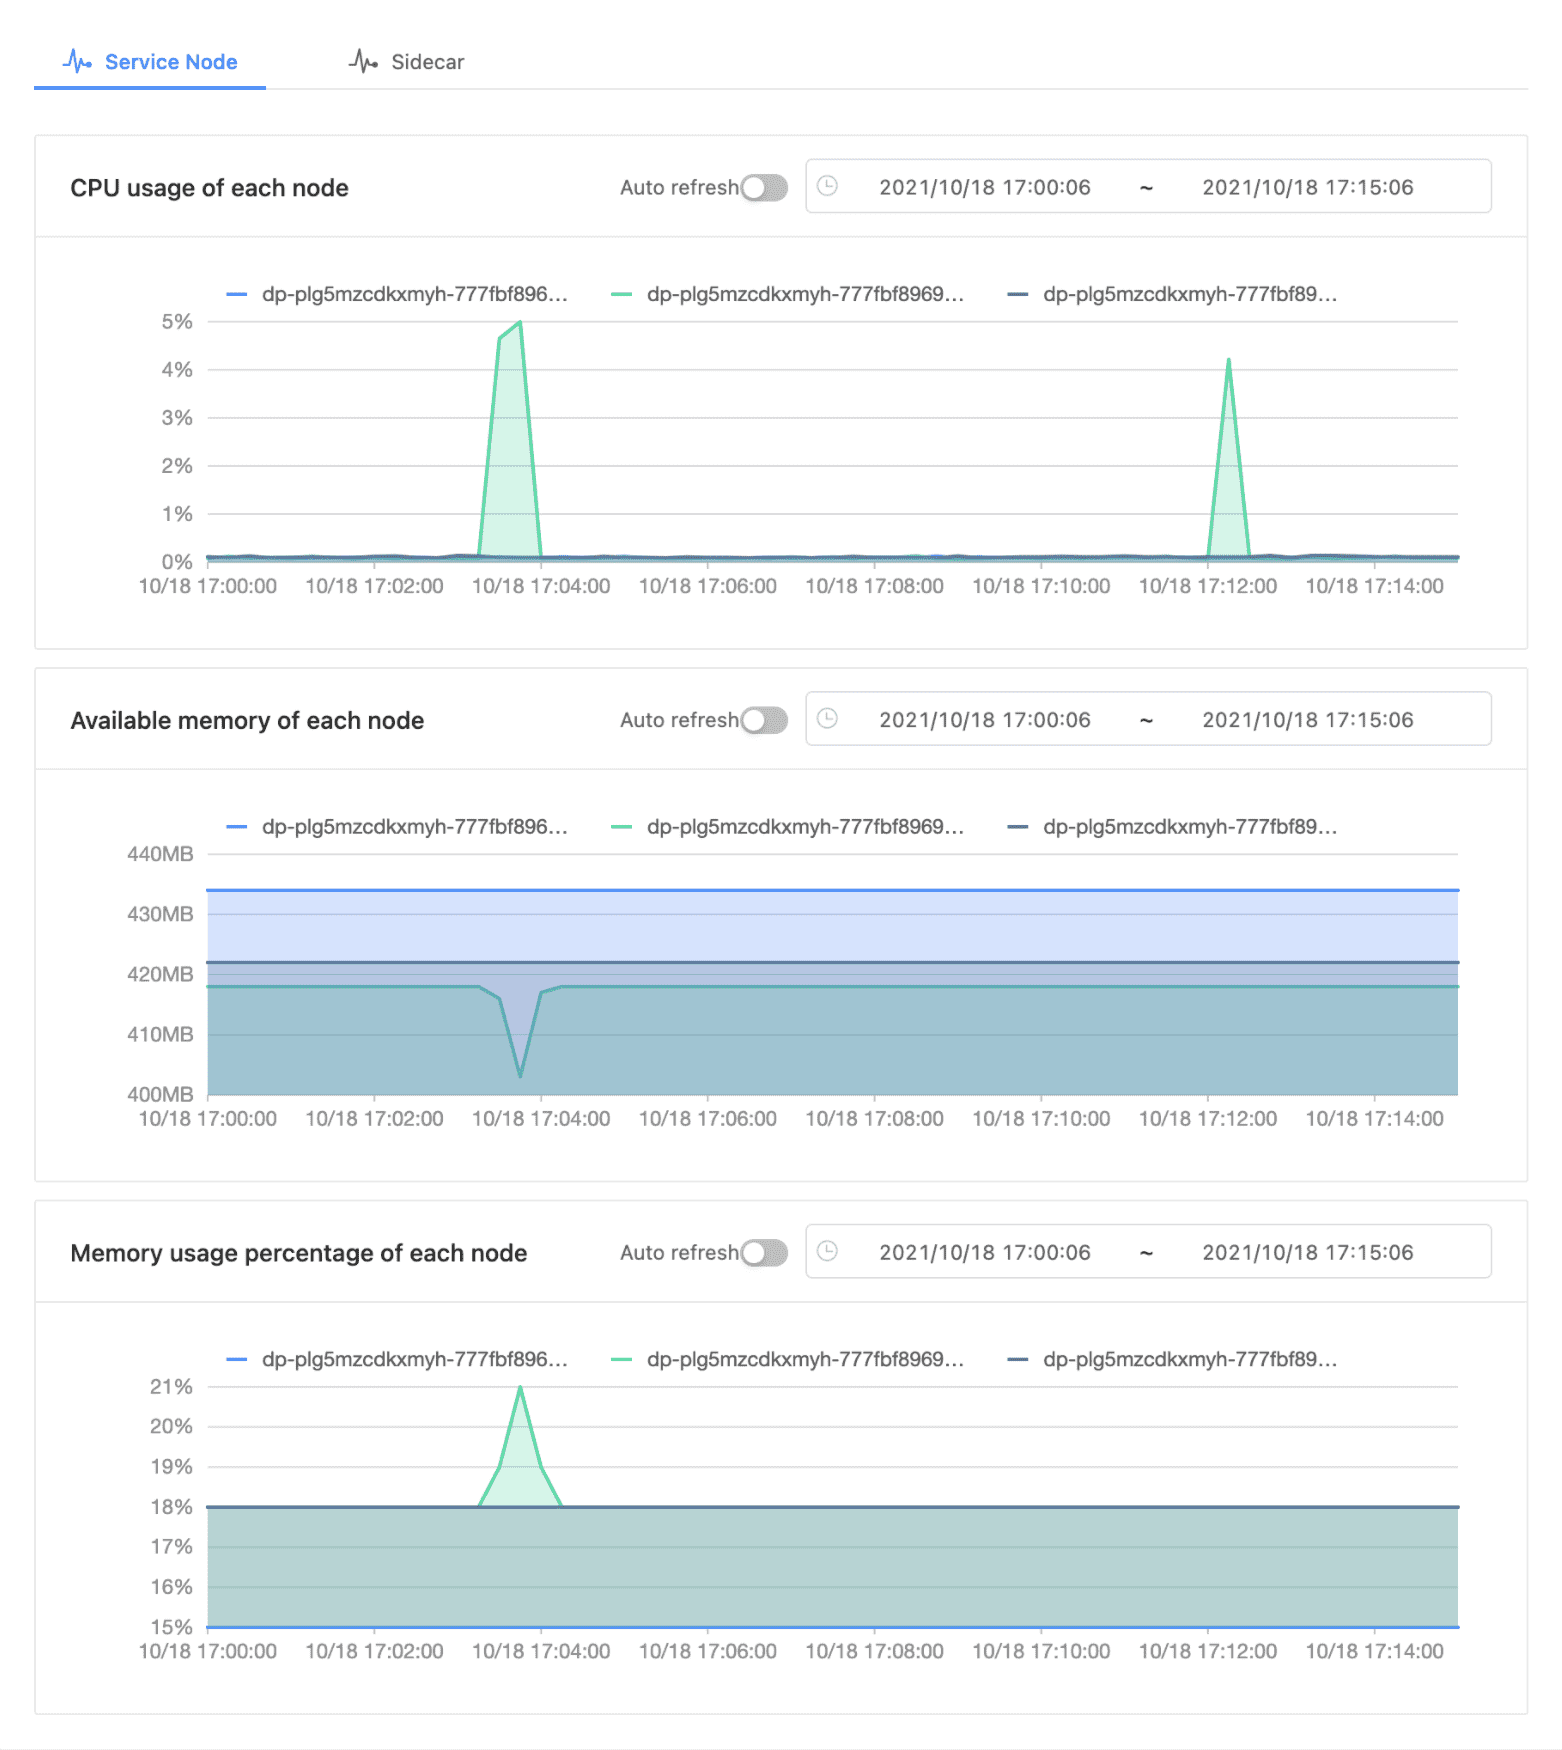
Service node resource usage
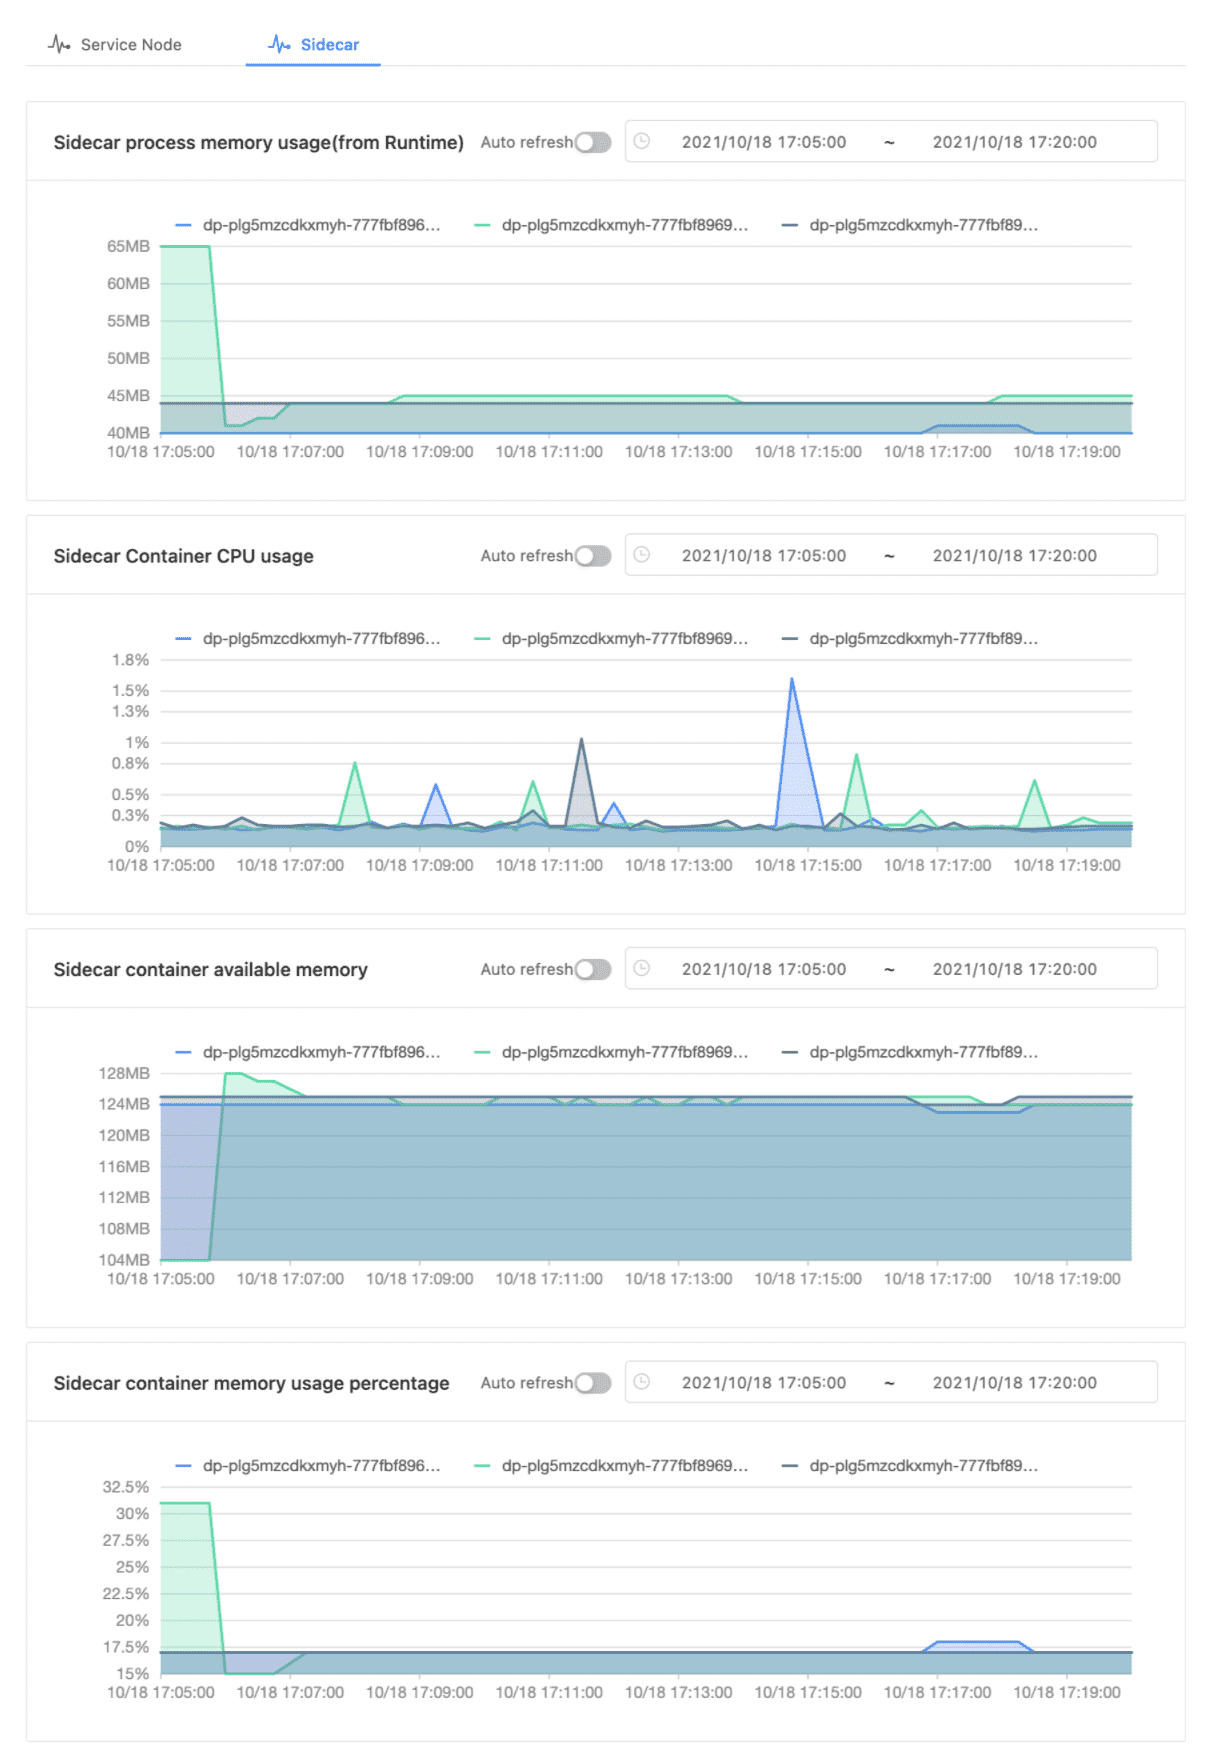
Sidecar resource usage
Nodes #
Events #
Services(Dynamic) #
Dynamic service includes two viewing perspectives: service perspective and instance perspective.
Service View #
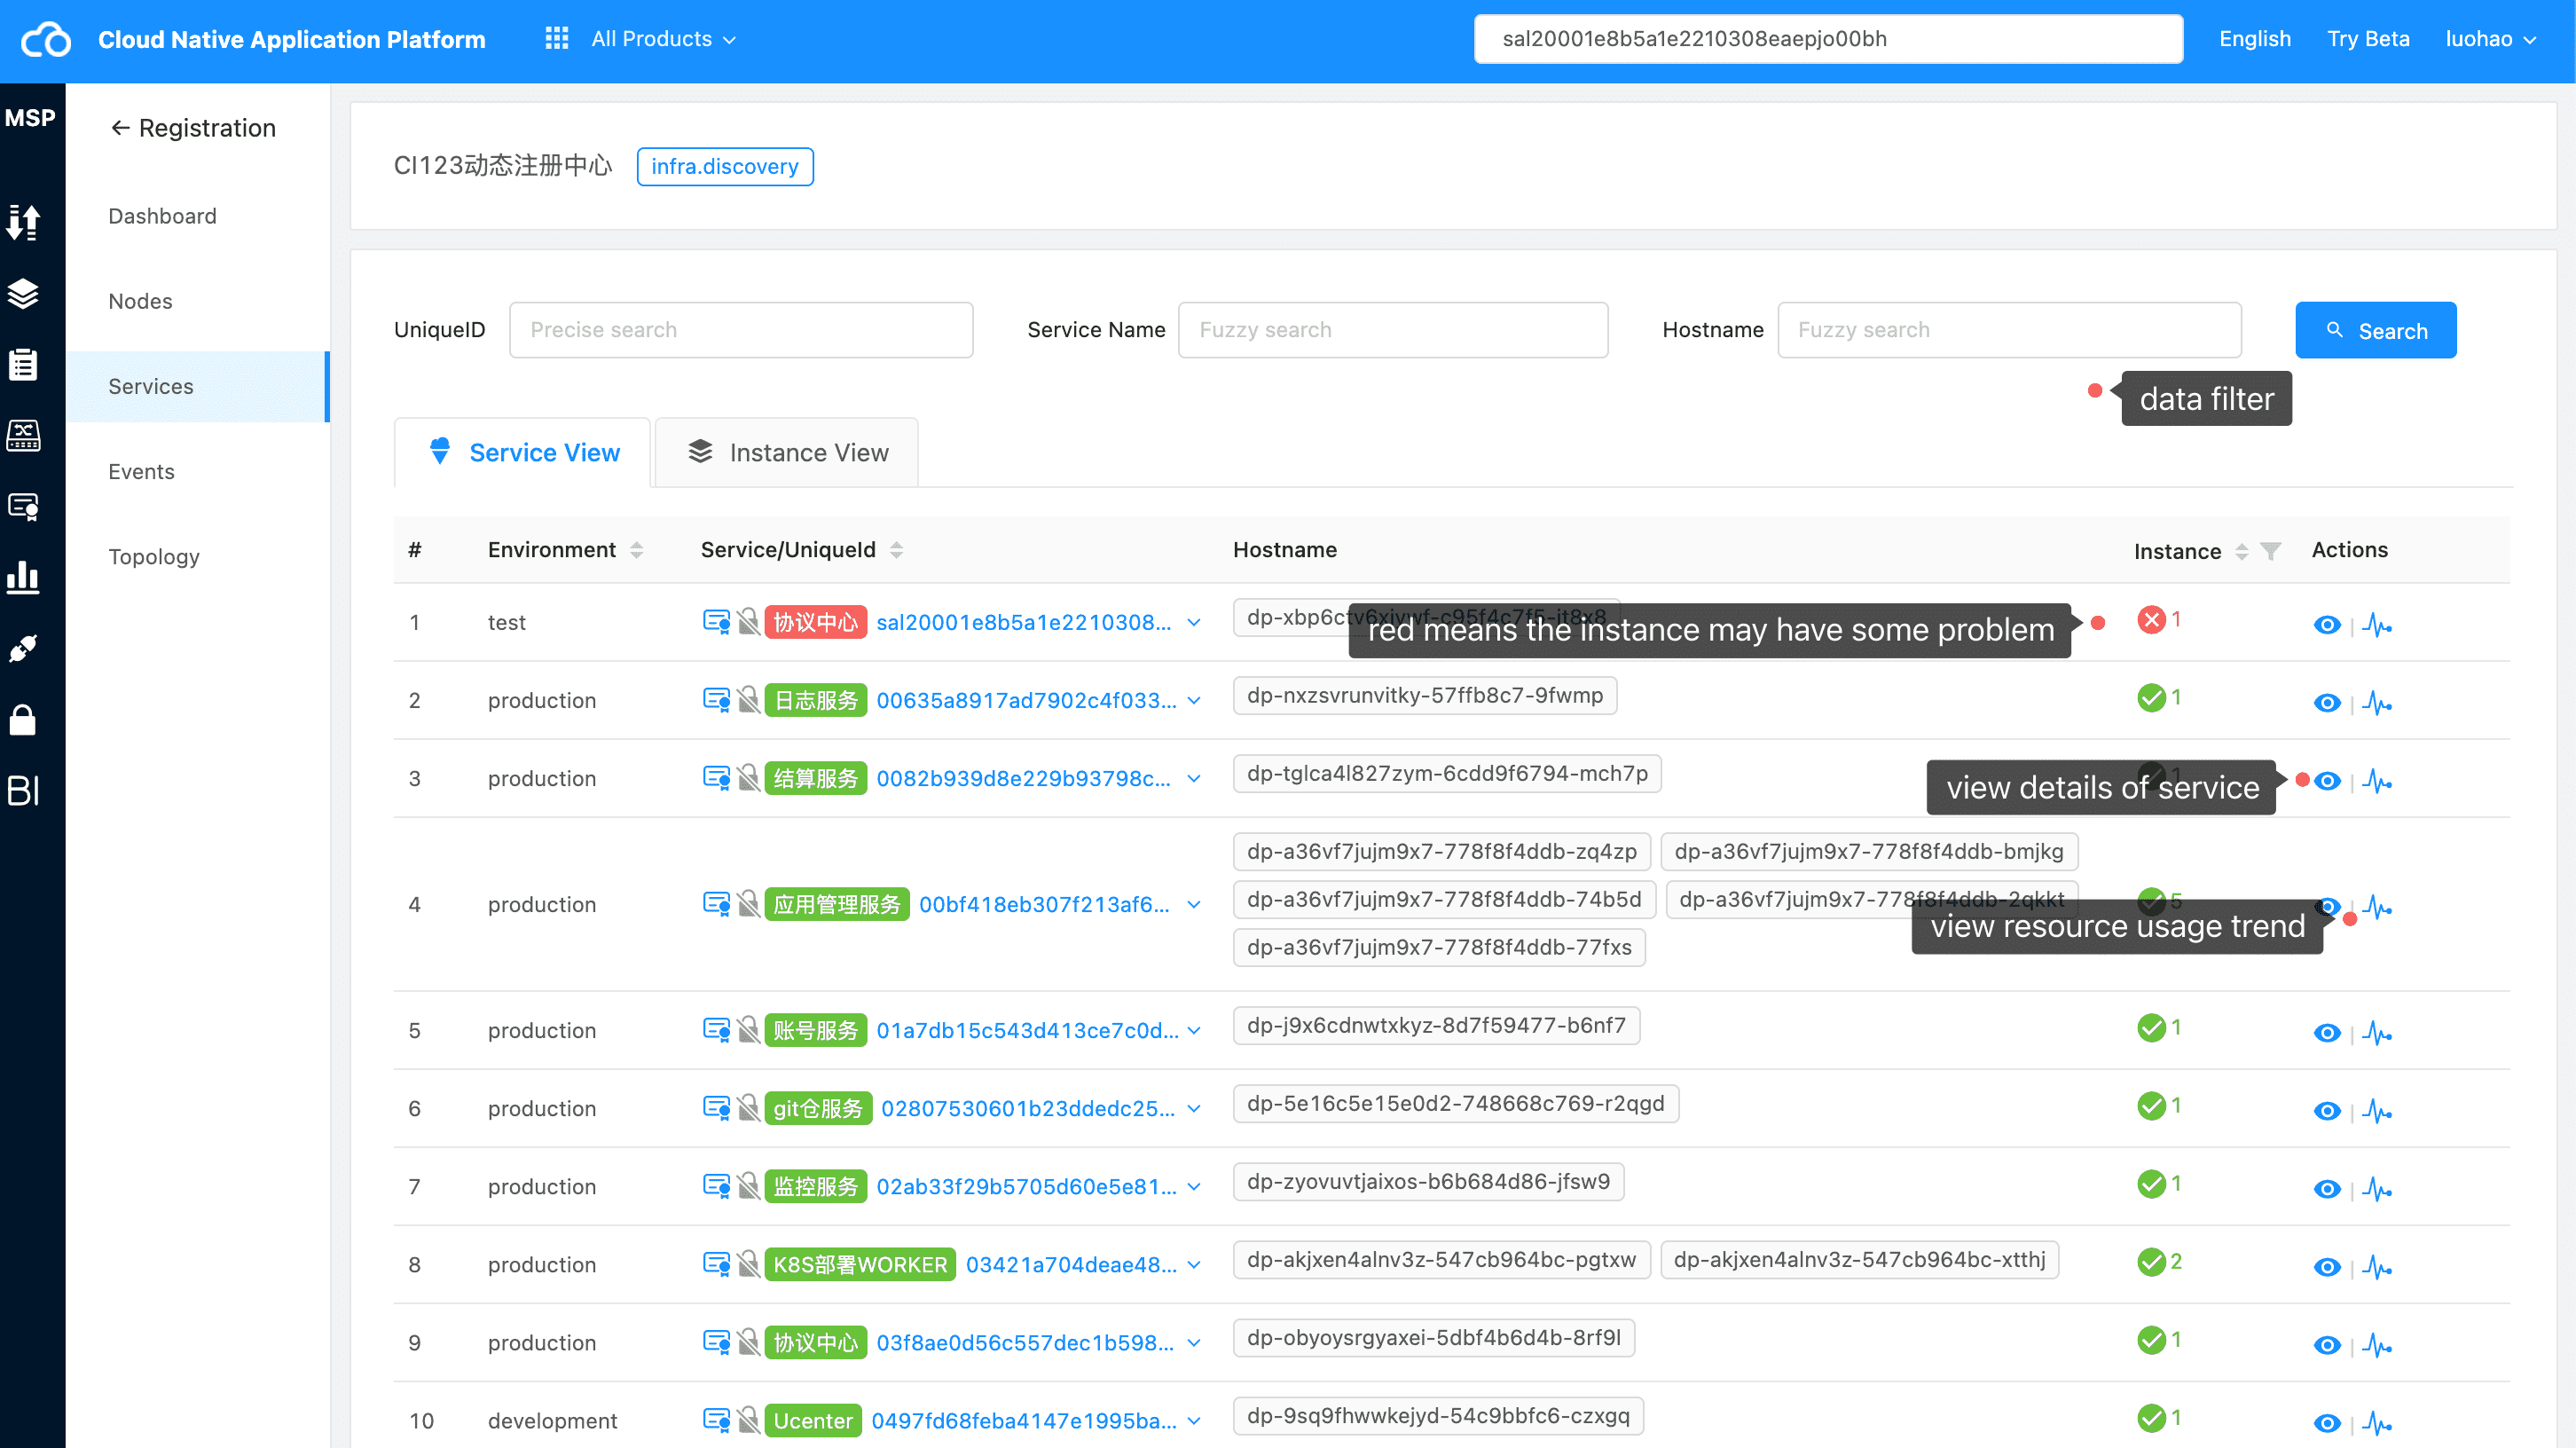
“Service perspective” to view service information
By clicking the “operation” item on the right, we can view more information about the service, including static attribute information and resource occupation information. After clicking, the effect is as follows:
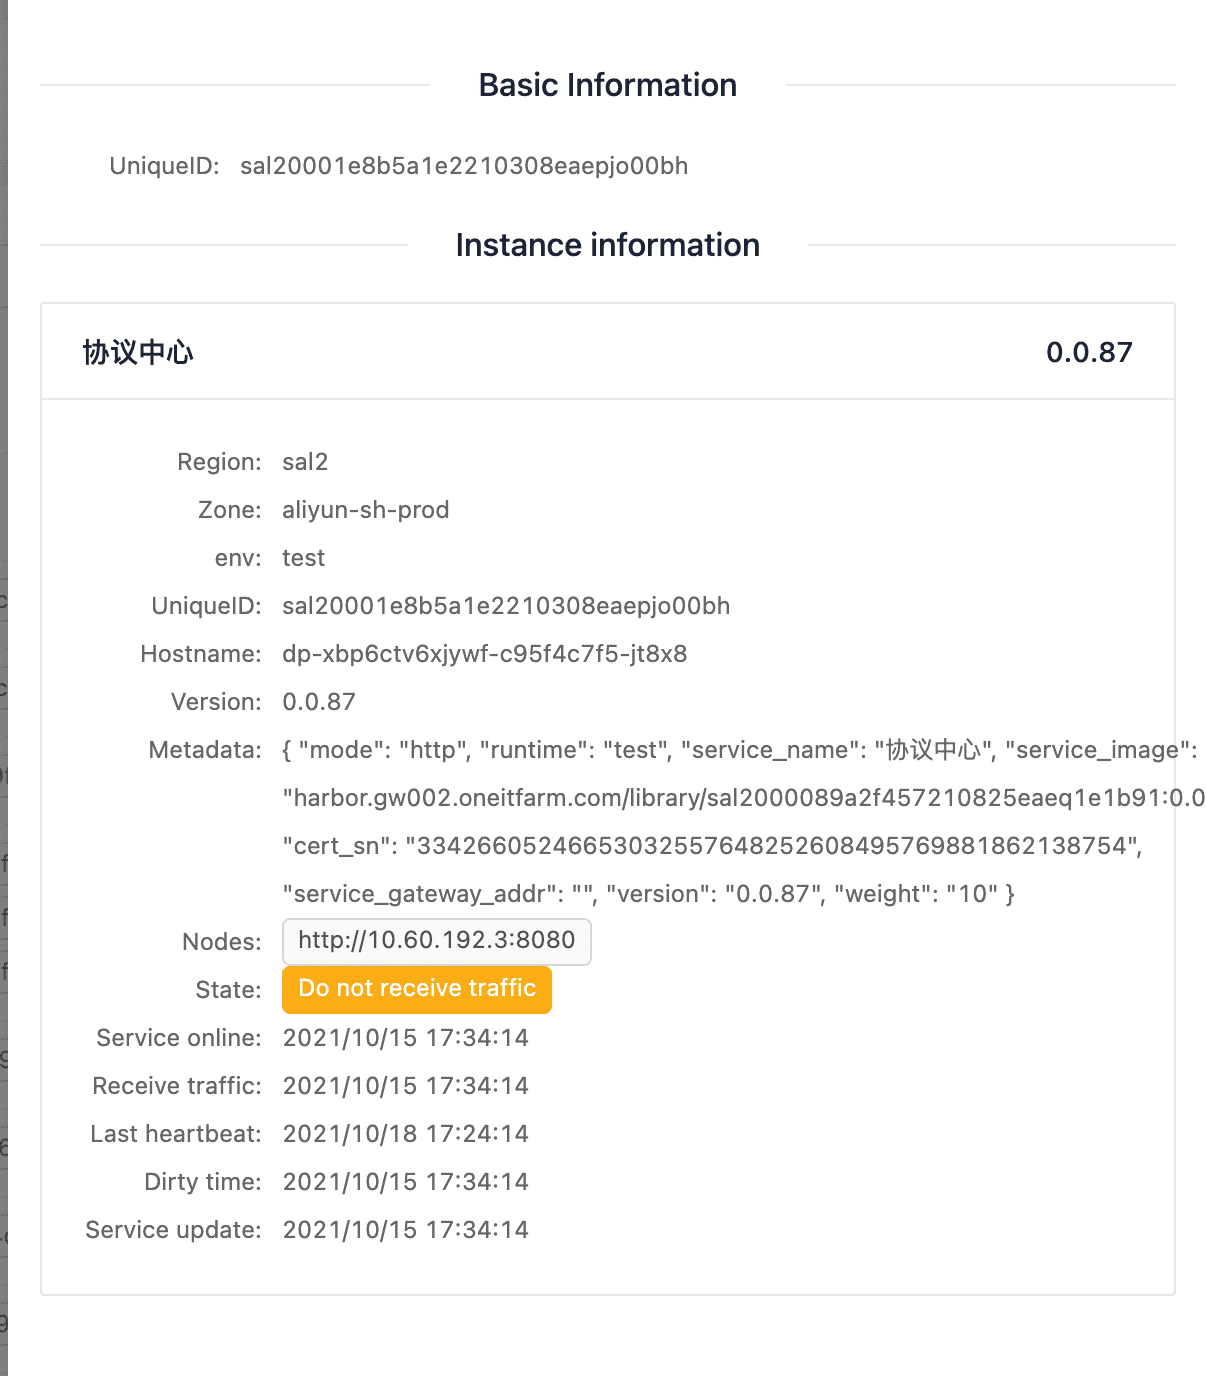
Click to view more service information
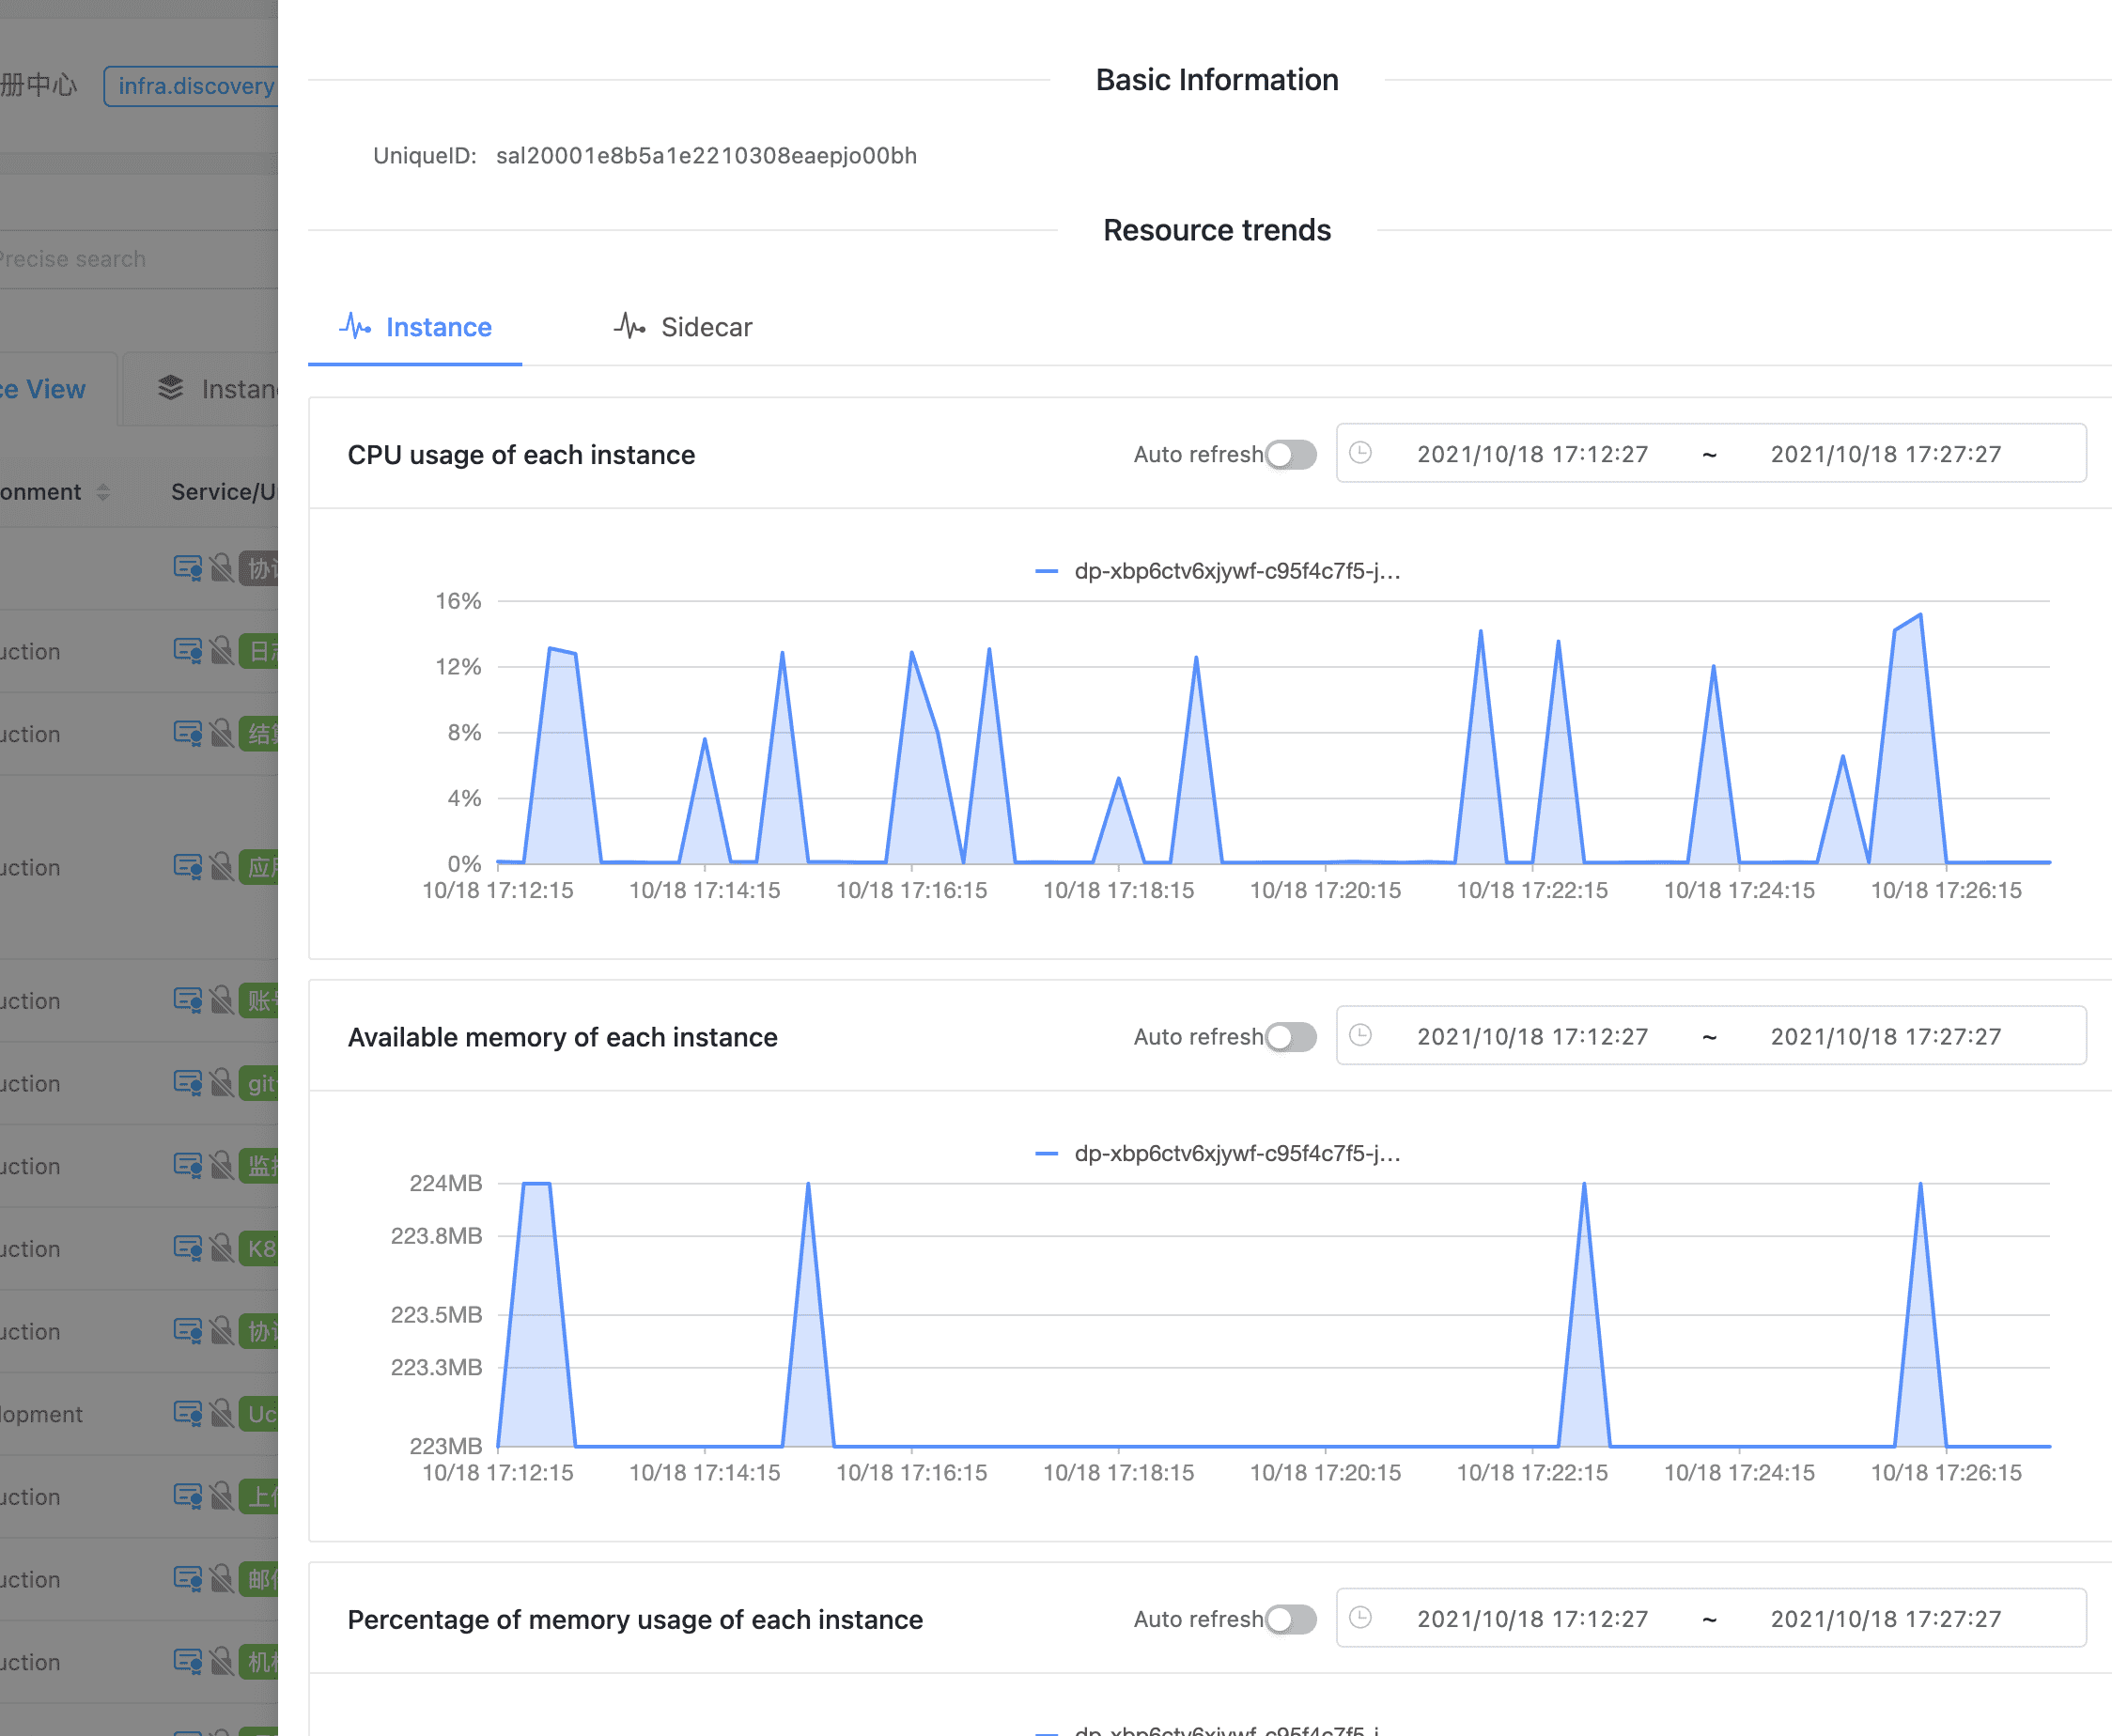
Click to view the resource usage chart
Instance View #
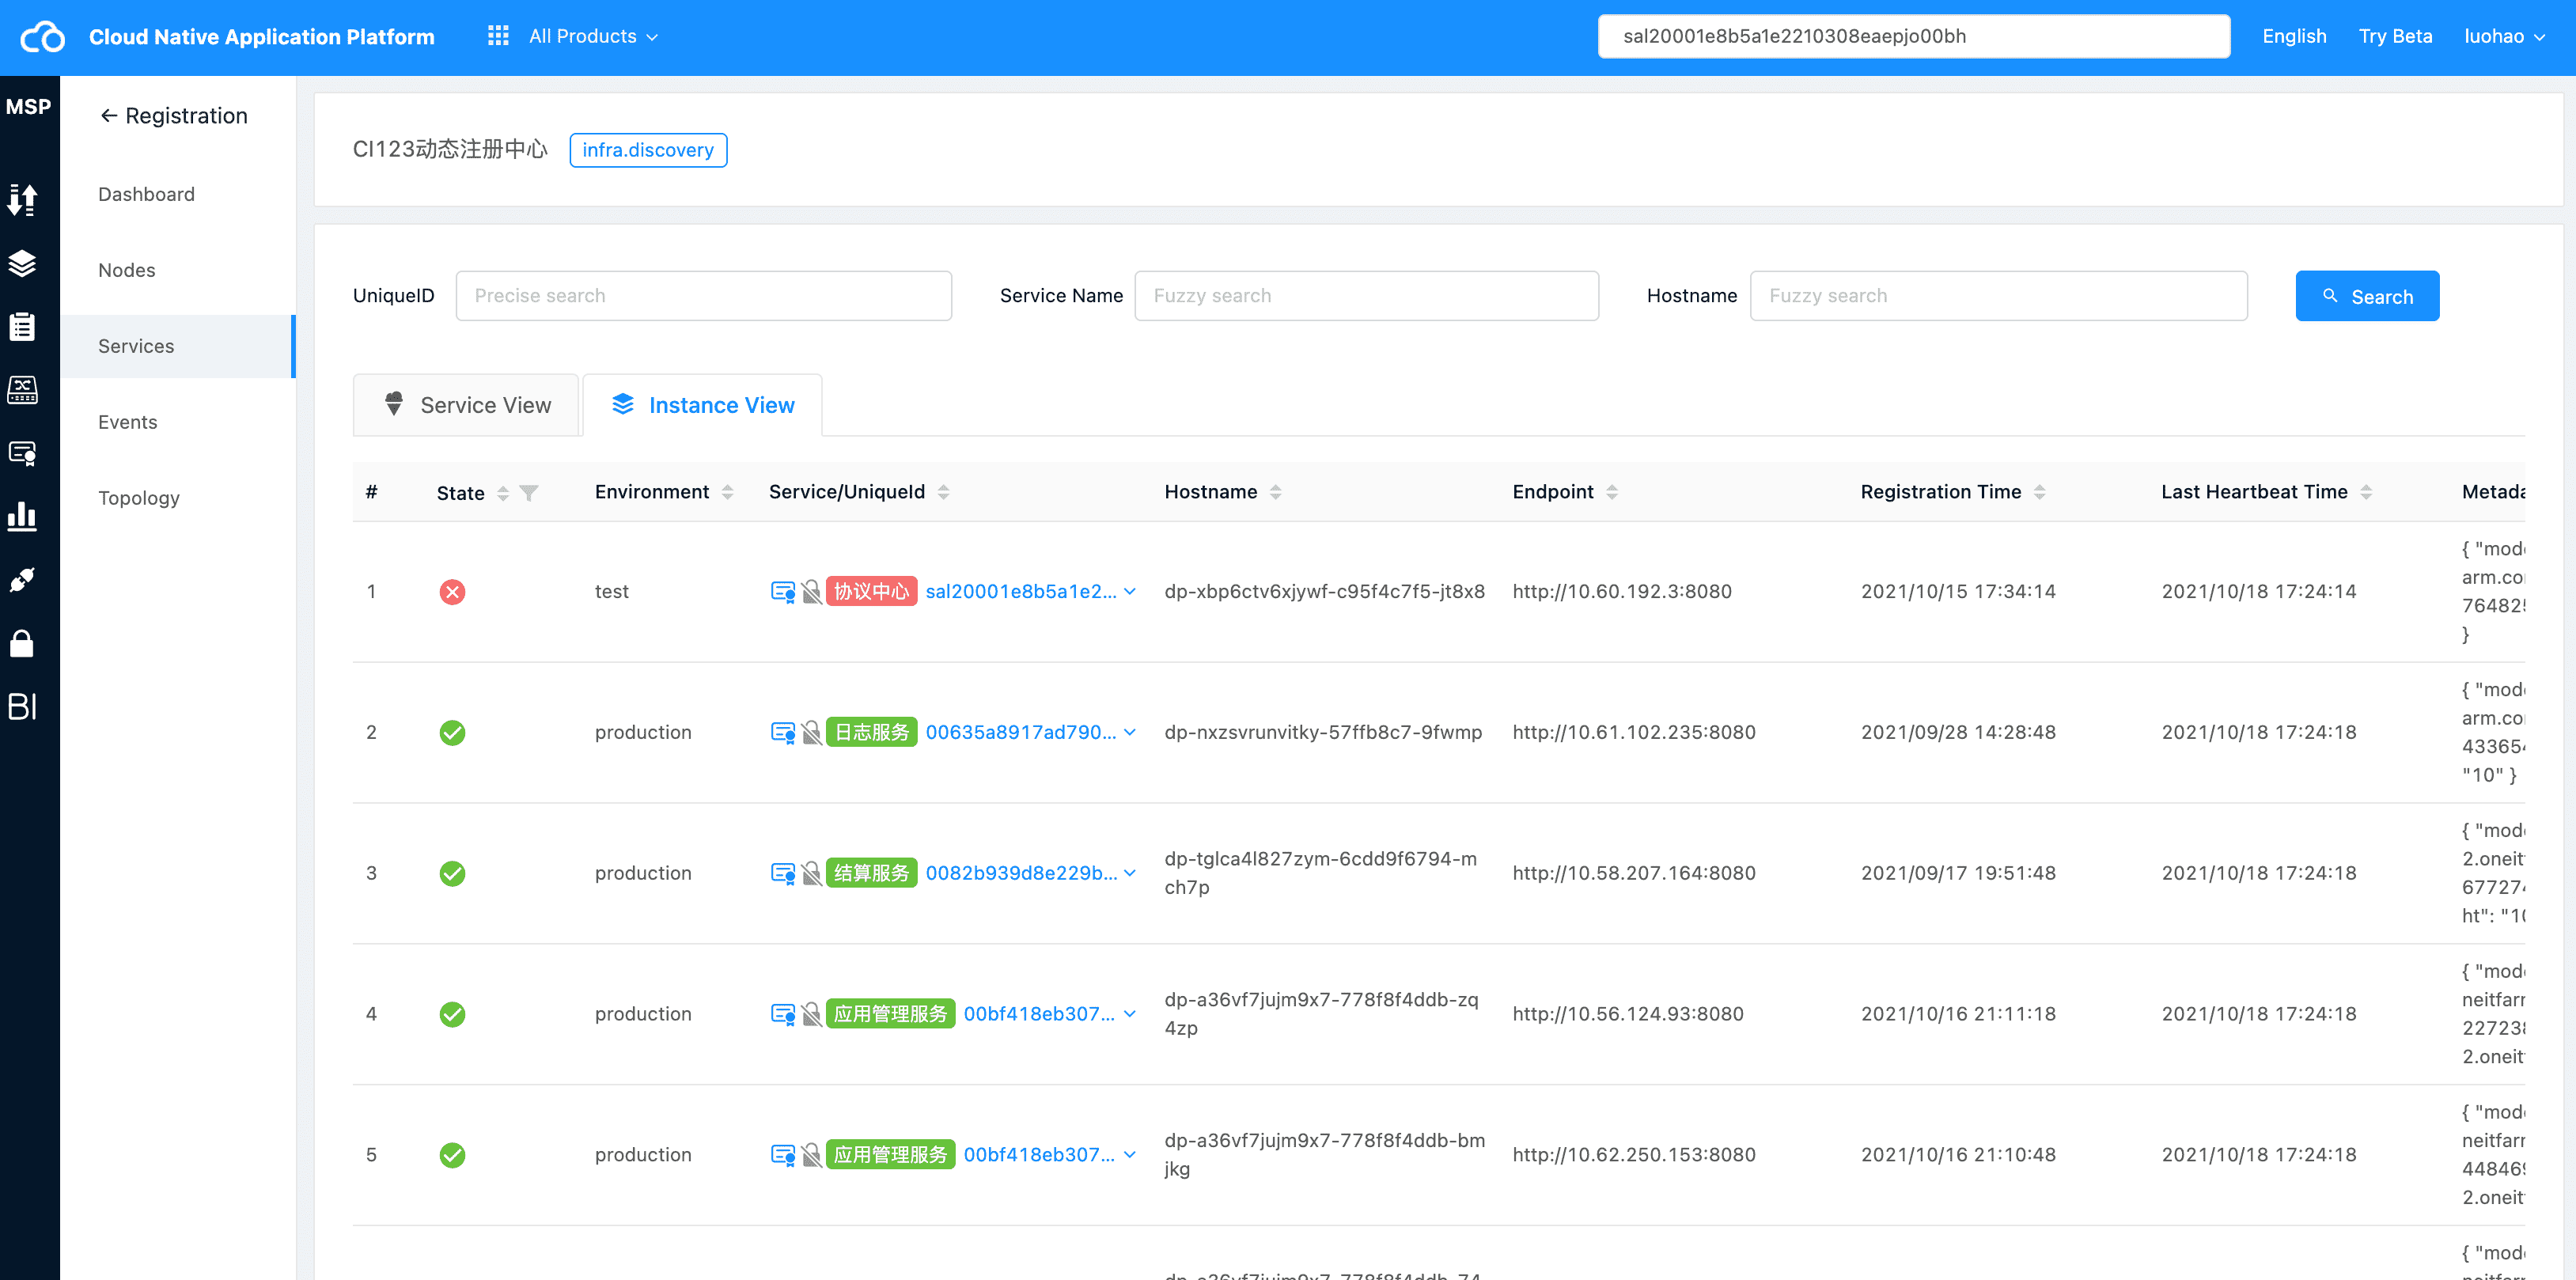
Instance view
Services(Static) #
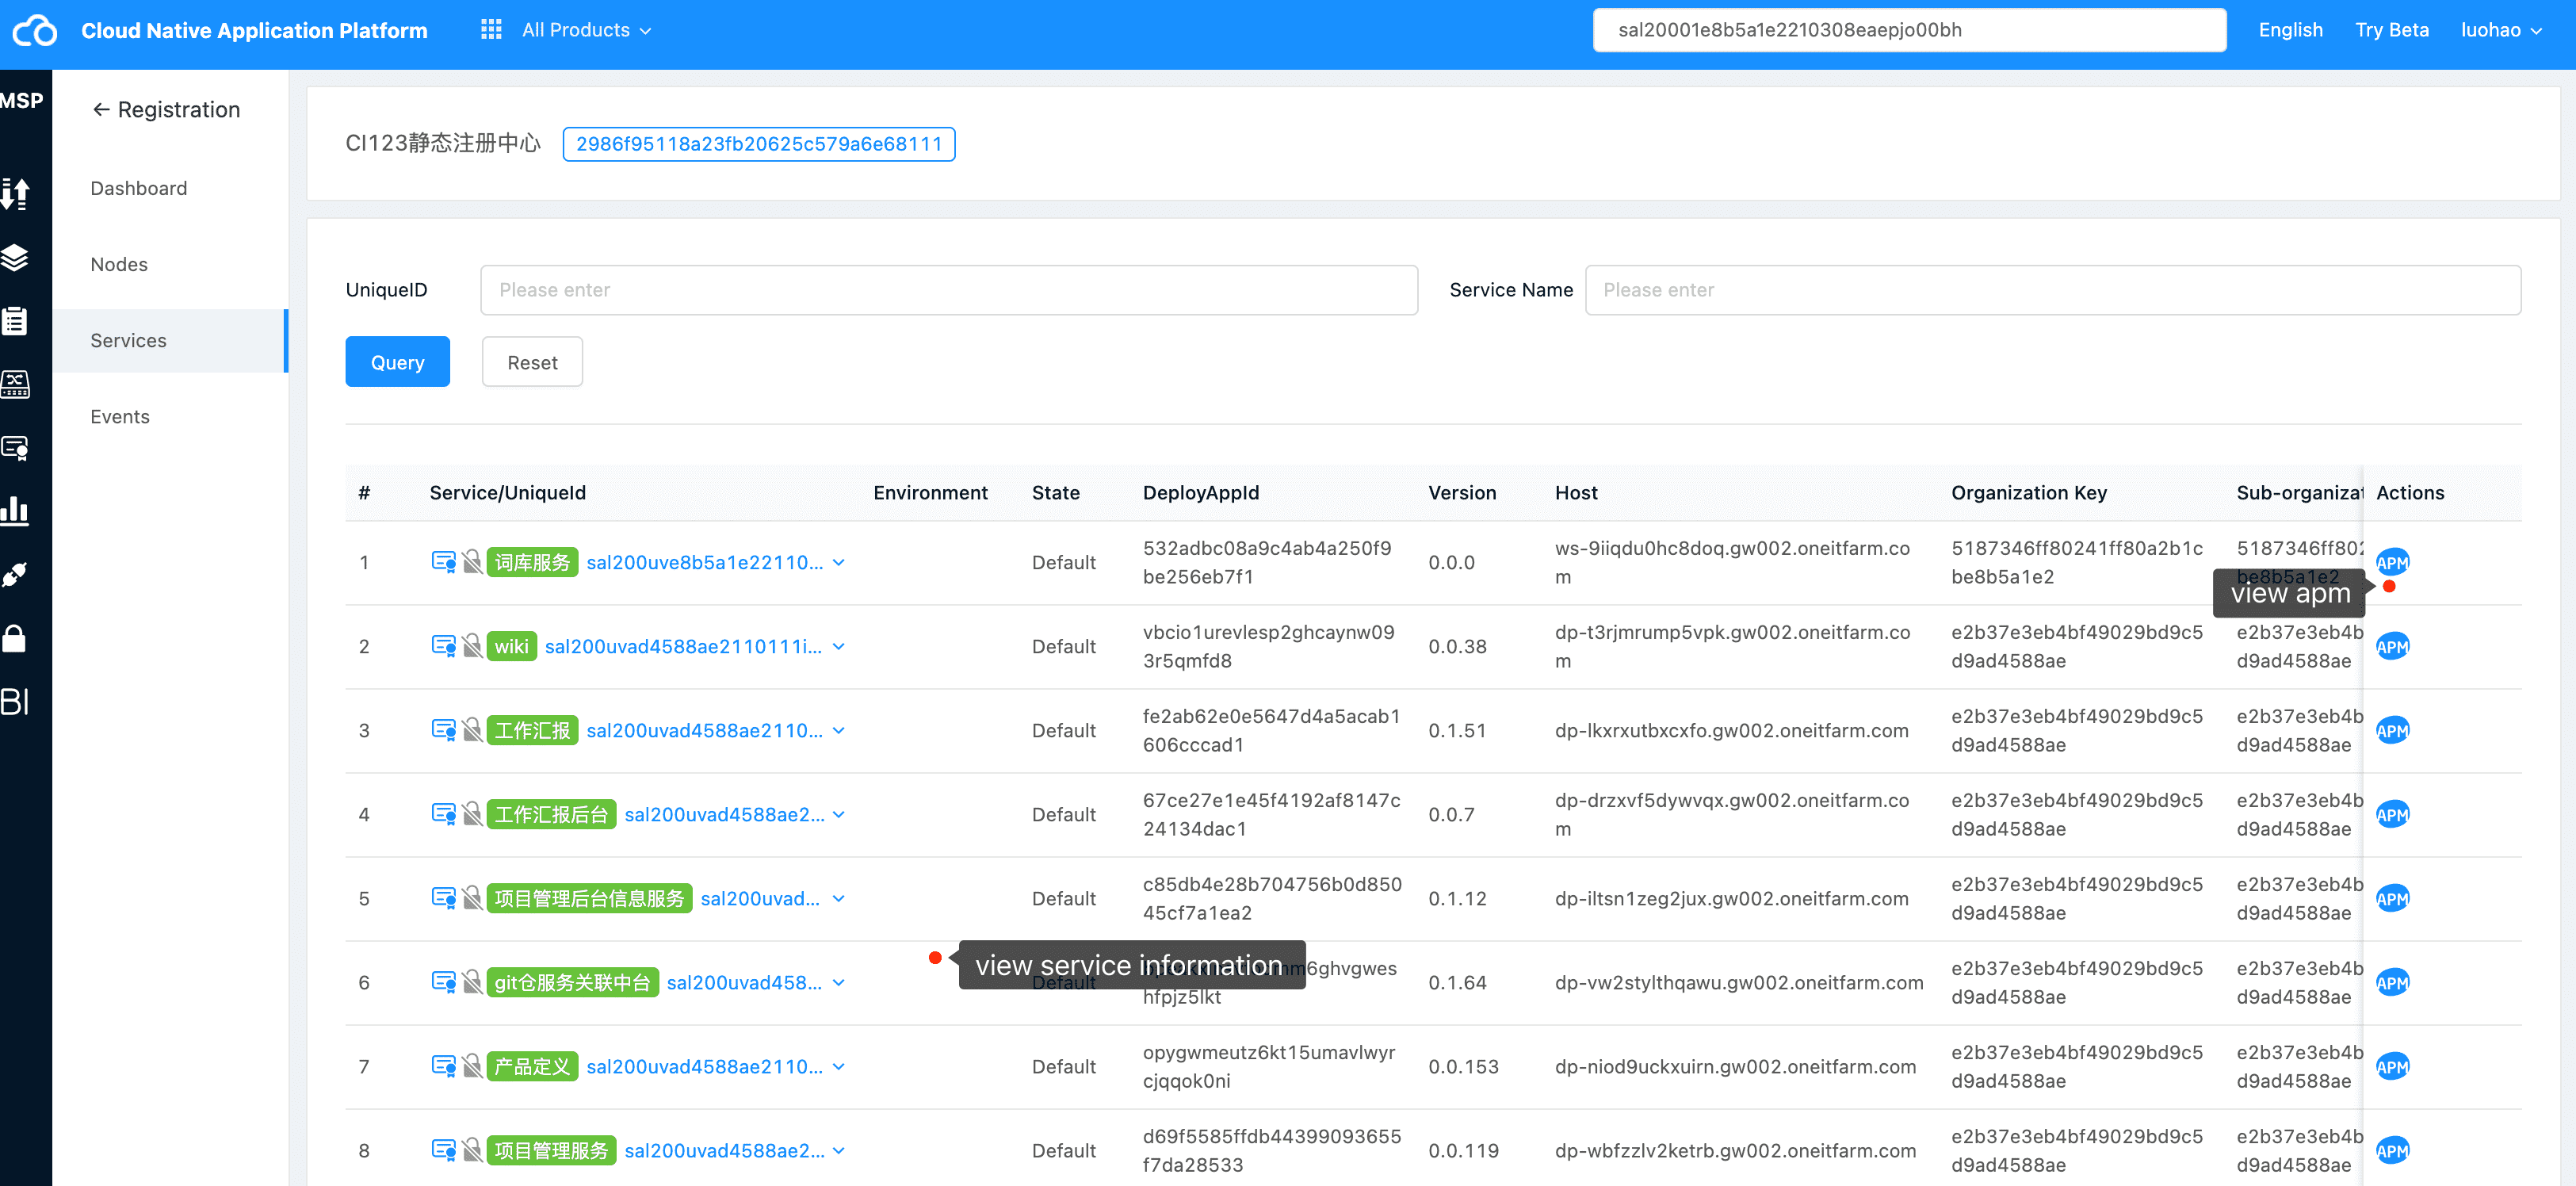
Topology(Dynamic) #
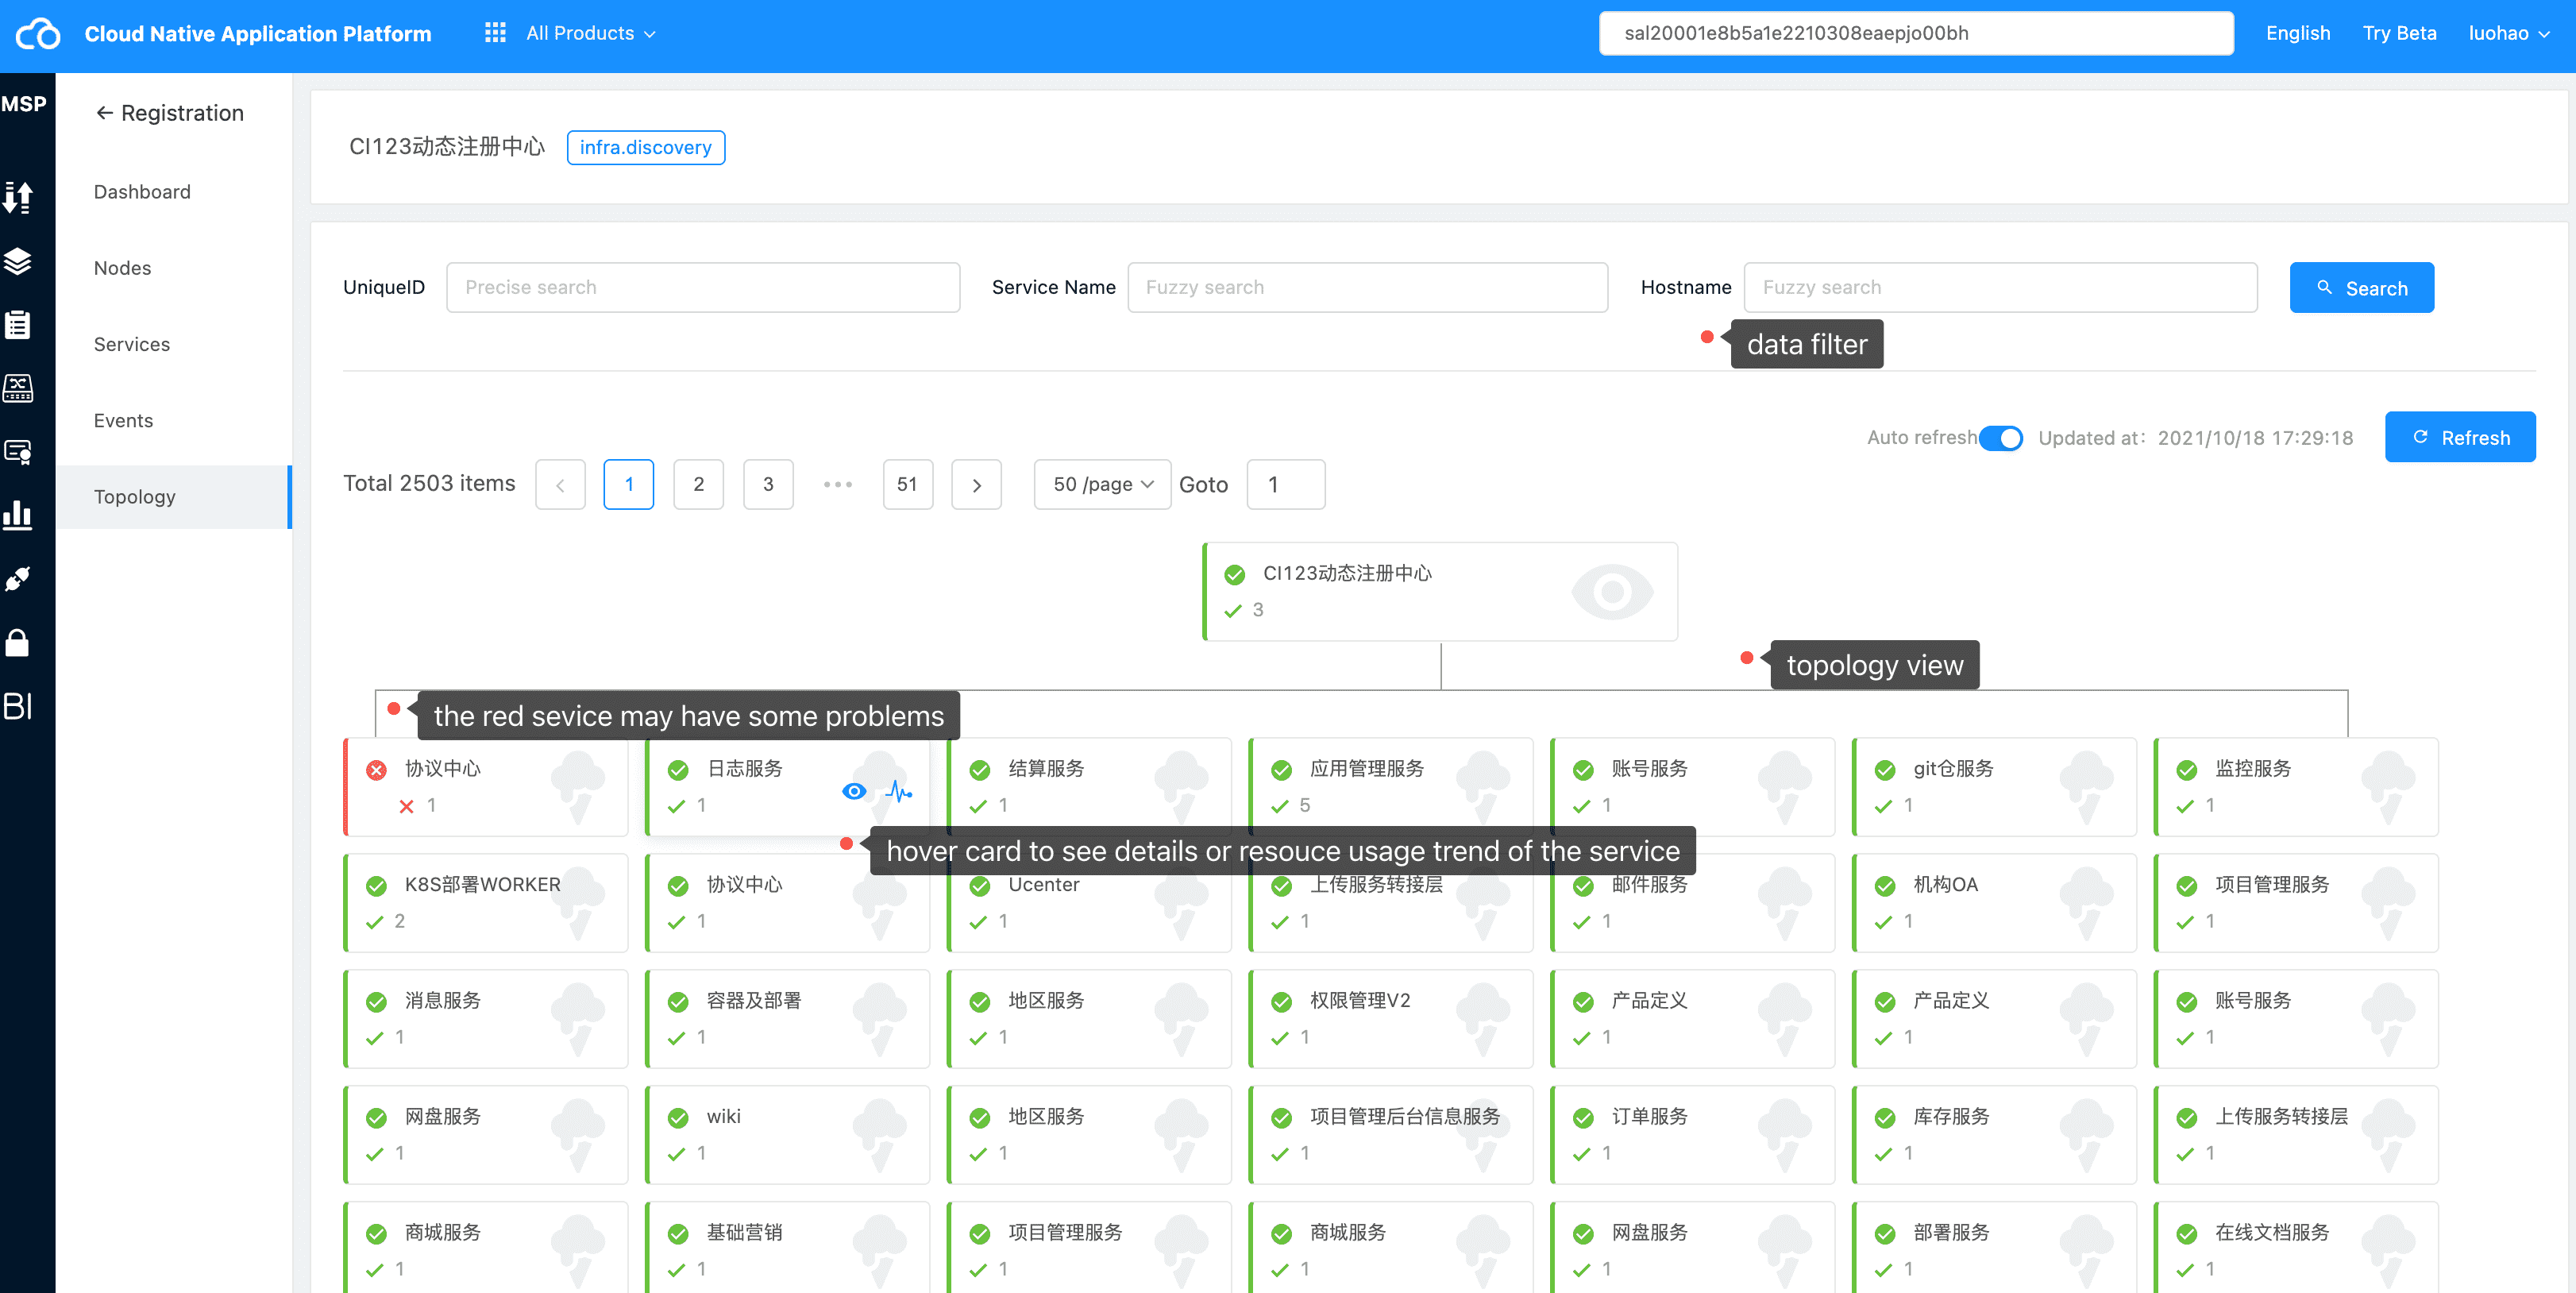
Through this module, we can see the registration information of the current registry service. When an exception occurs in the service, it will be marked in red.
In addition, by hovering on the “service” card, we can view more information about the service, including service attribute information and resource usage of service operation.