Dashboard #
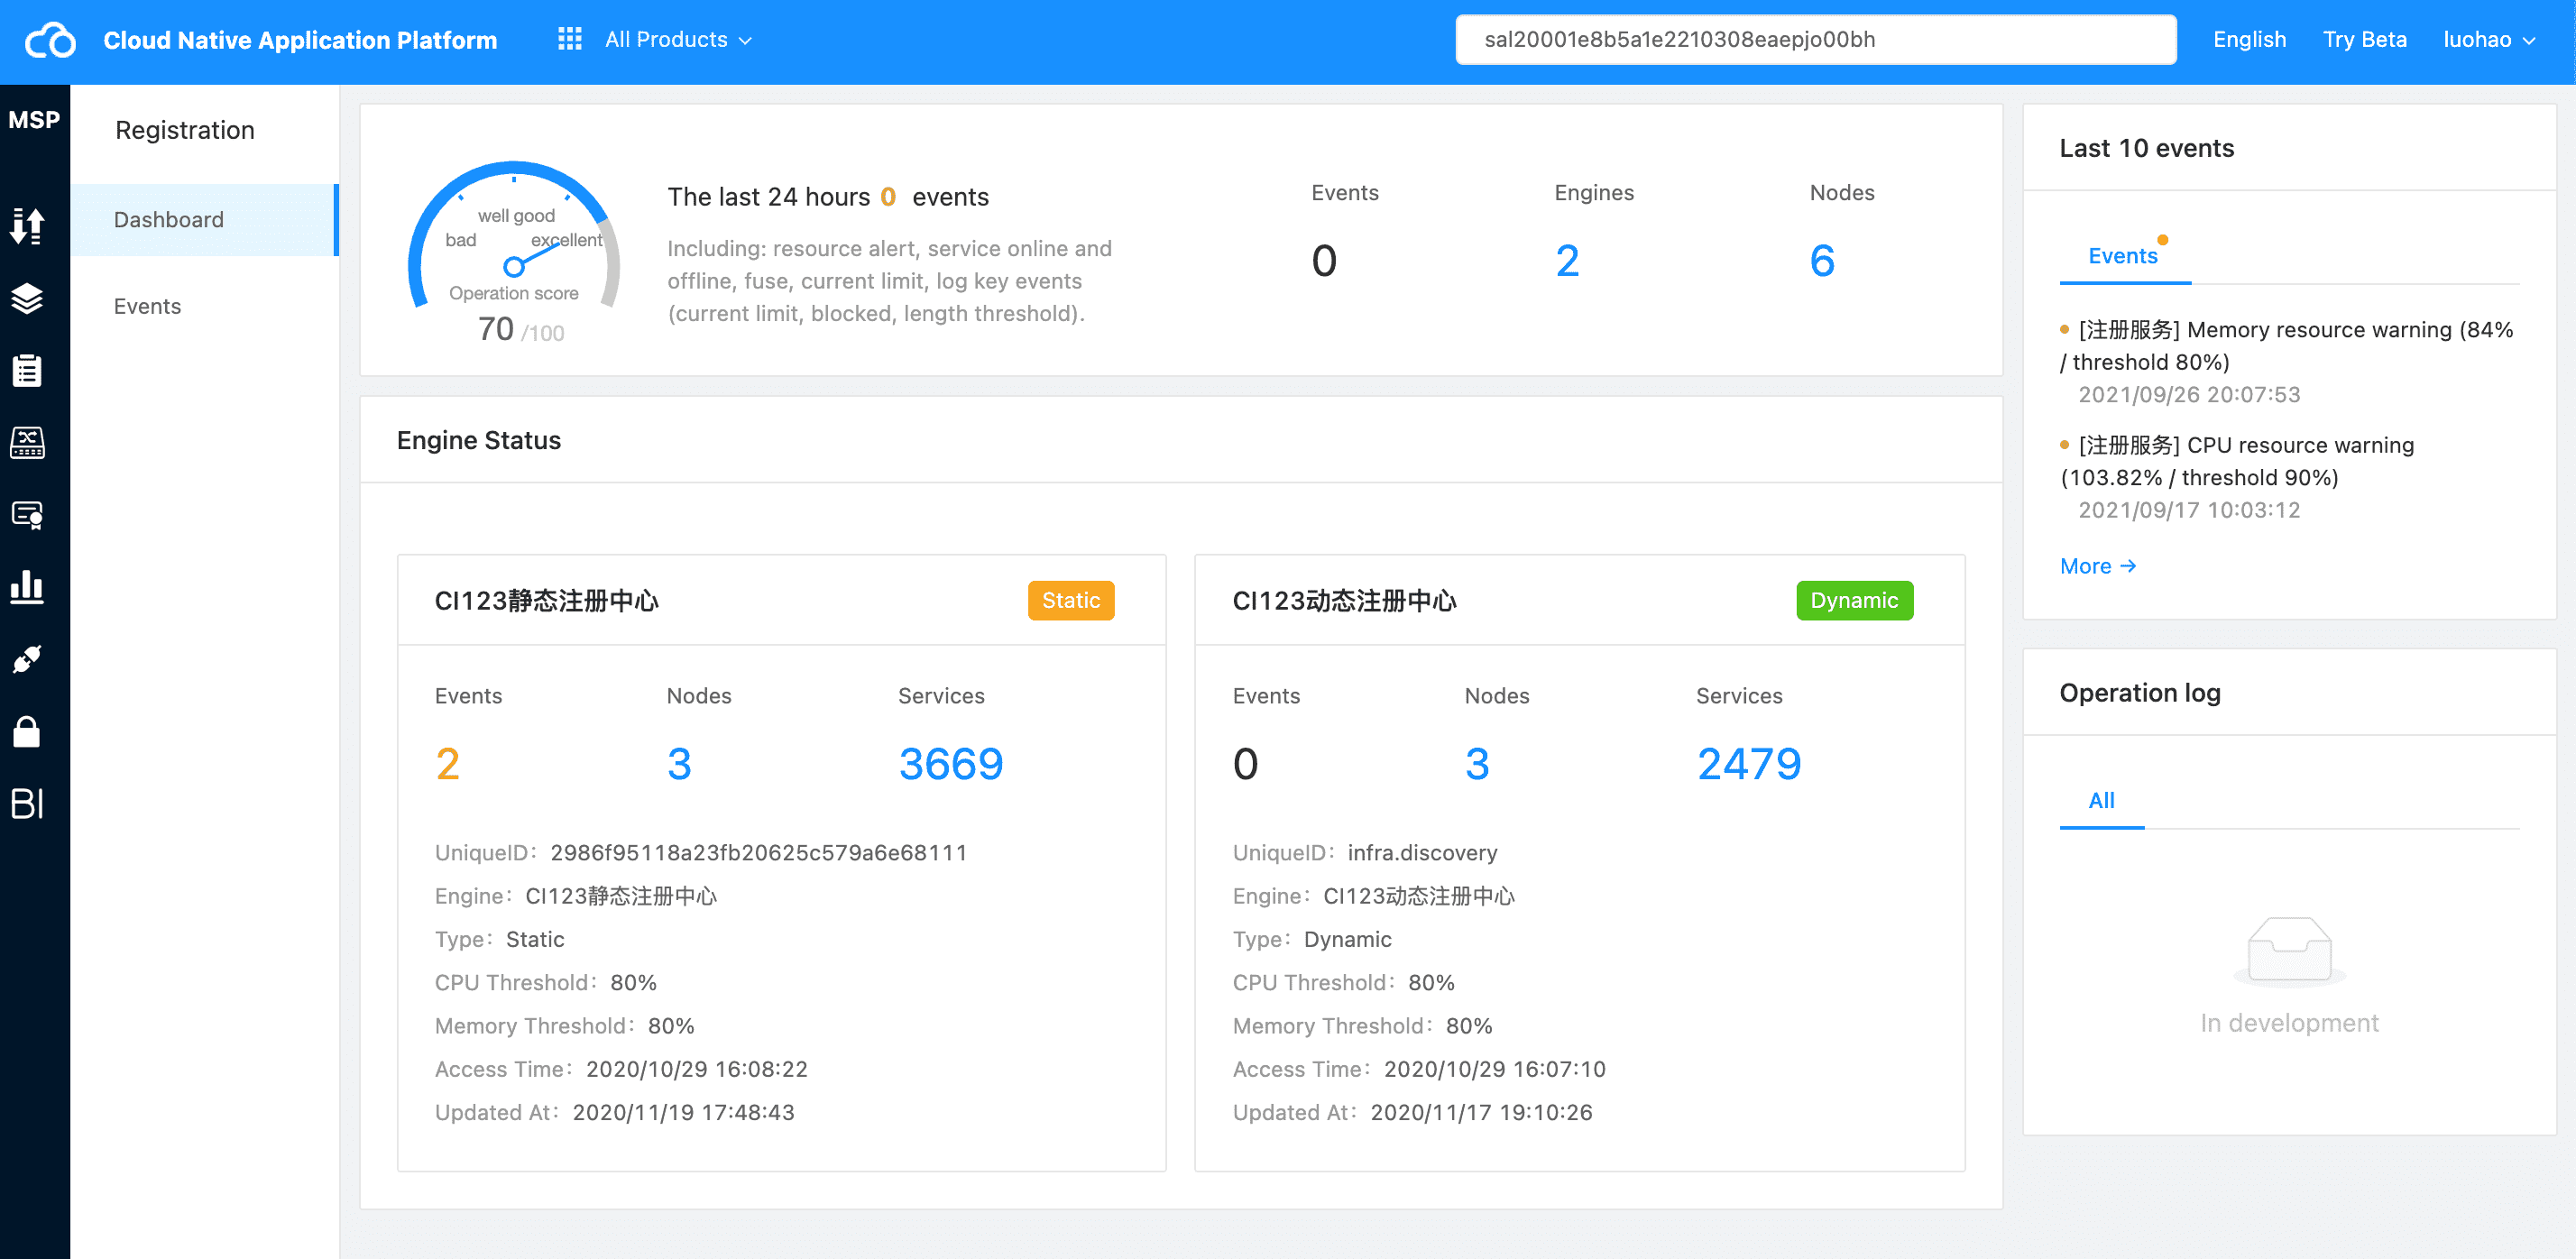
Summary #
The registry focuses on the operation of the “registry engine”, monitors and measures the registry cluster itself, and provides monitoring and measurement support for its stable operation.
In addition, you can view the operation of registered services in the registry.
Best Practice #
After entering the registry module, you need to pay attention to the quantity statistics of “resource warning” and “recent events”.
If a pending event occurs, click to view the details of the specific event.
At the same time, we can view the resource consumption trend of the engine on the “details” page. Through time filtering, we can view the resource consumption near the event time and further locate the problem.
Module Introduction #
Resource Overview Card #

This card lists the monitoring events and engine overview that the current registry needs to pay attention to. Click the corresponding indicator to view the details.
Engine Status Card #
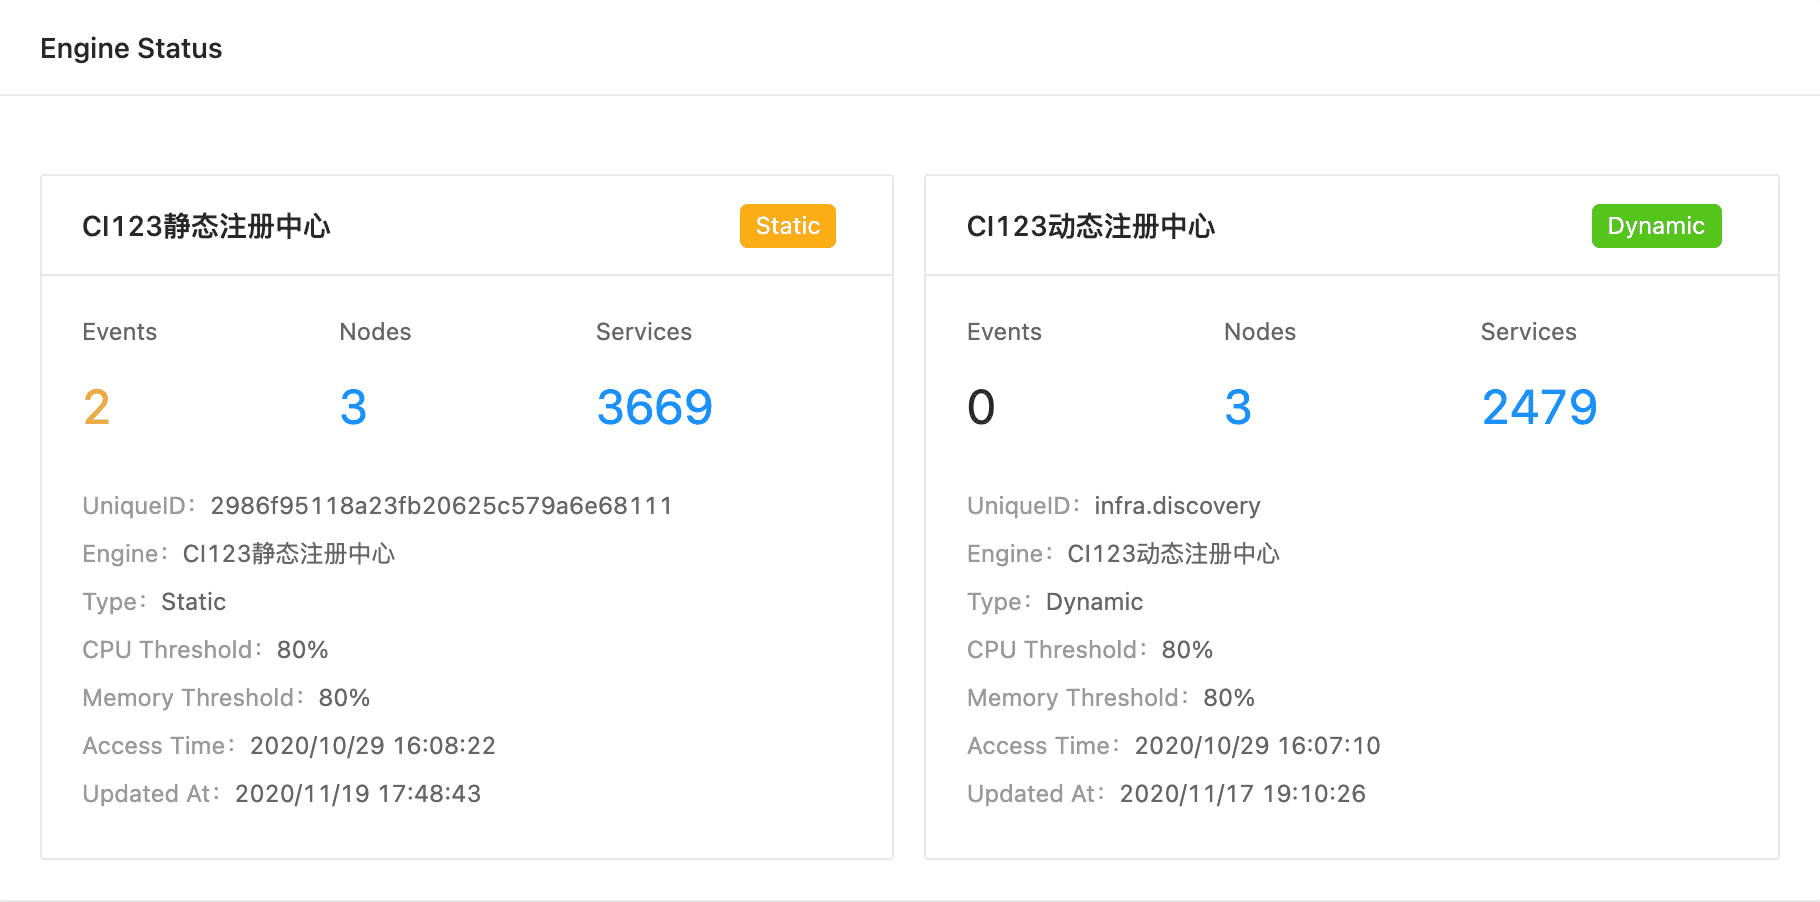
Through the engine status card, we can access the running overview of the current registry engine, including:
- Basic information of the registry, including service identification number, name, type, threshold and practice.
- The current resource overview of the engine, including the number of nodes and registration services
- An overview of the operation of the engine, including: resource alert
Click each data on the card to view the details. Please refer to the details.
Recent Events Card #
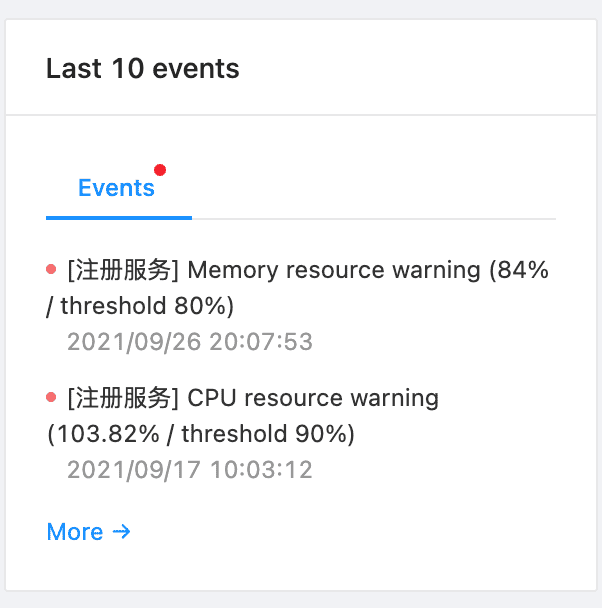
By viewing recent events, we can quickly see the recent events in the registry. By clicking view more, we can further view the specific alert information. See Events for more information.