Tracing #
Tracing provides developers of distributed applications with complete call link restoration, call request statistics, link topology, application dependency analysis and other tools, which can help developers quickly analyze and diagnose the performance bottlenecks under the distributed application architecture and improve the development and diagnosis efficiency in the era of microservices.
Trace List #
The link list summarizes the link information of the platform or service. You can
- Search link information
- View link details, analyze application dependencies, etc
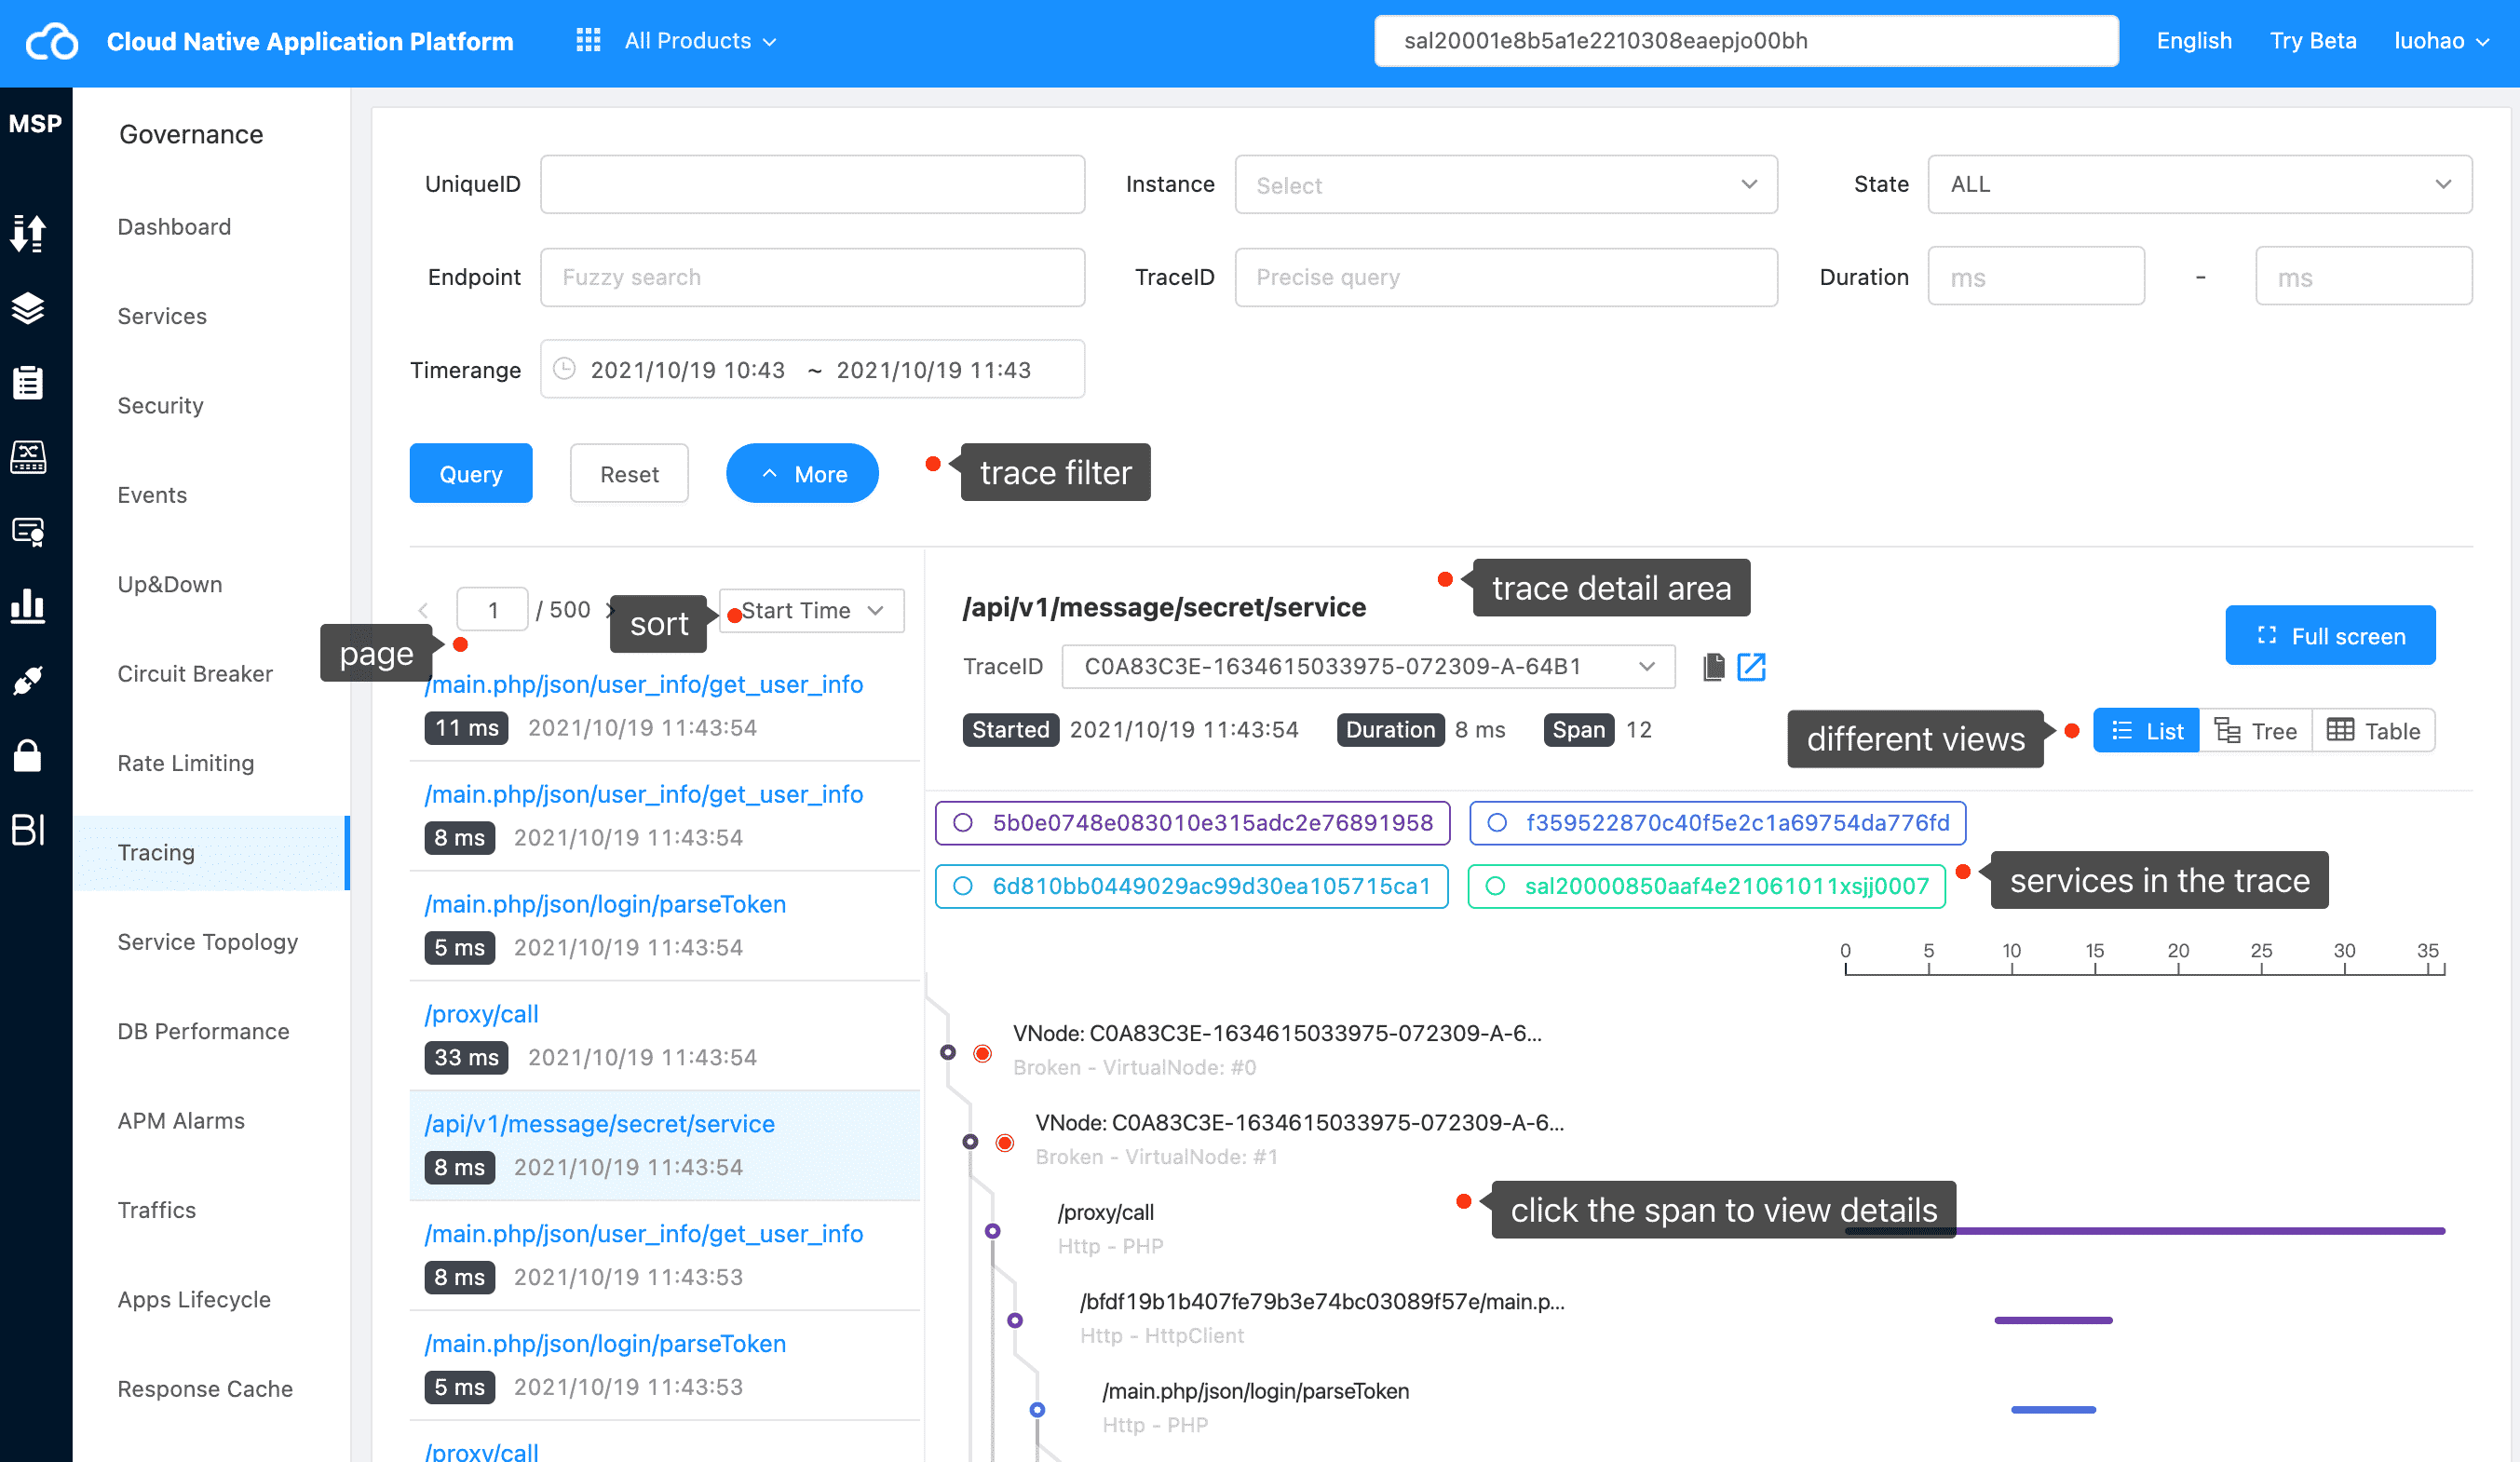
Trace Detail #
The platform provides link information viewing from three perspectives: list, tree structure and table.
List #
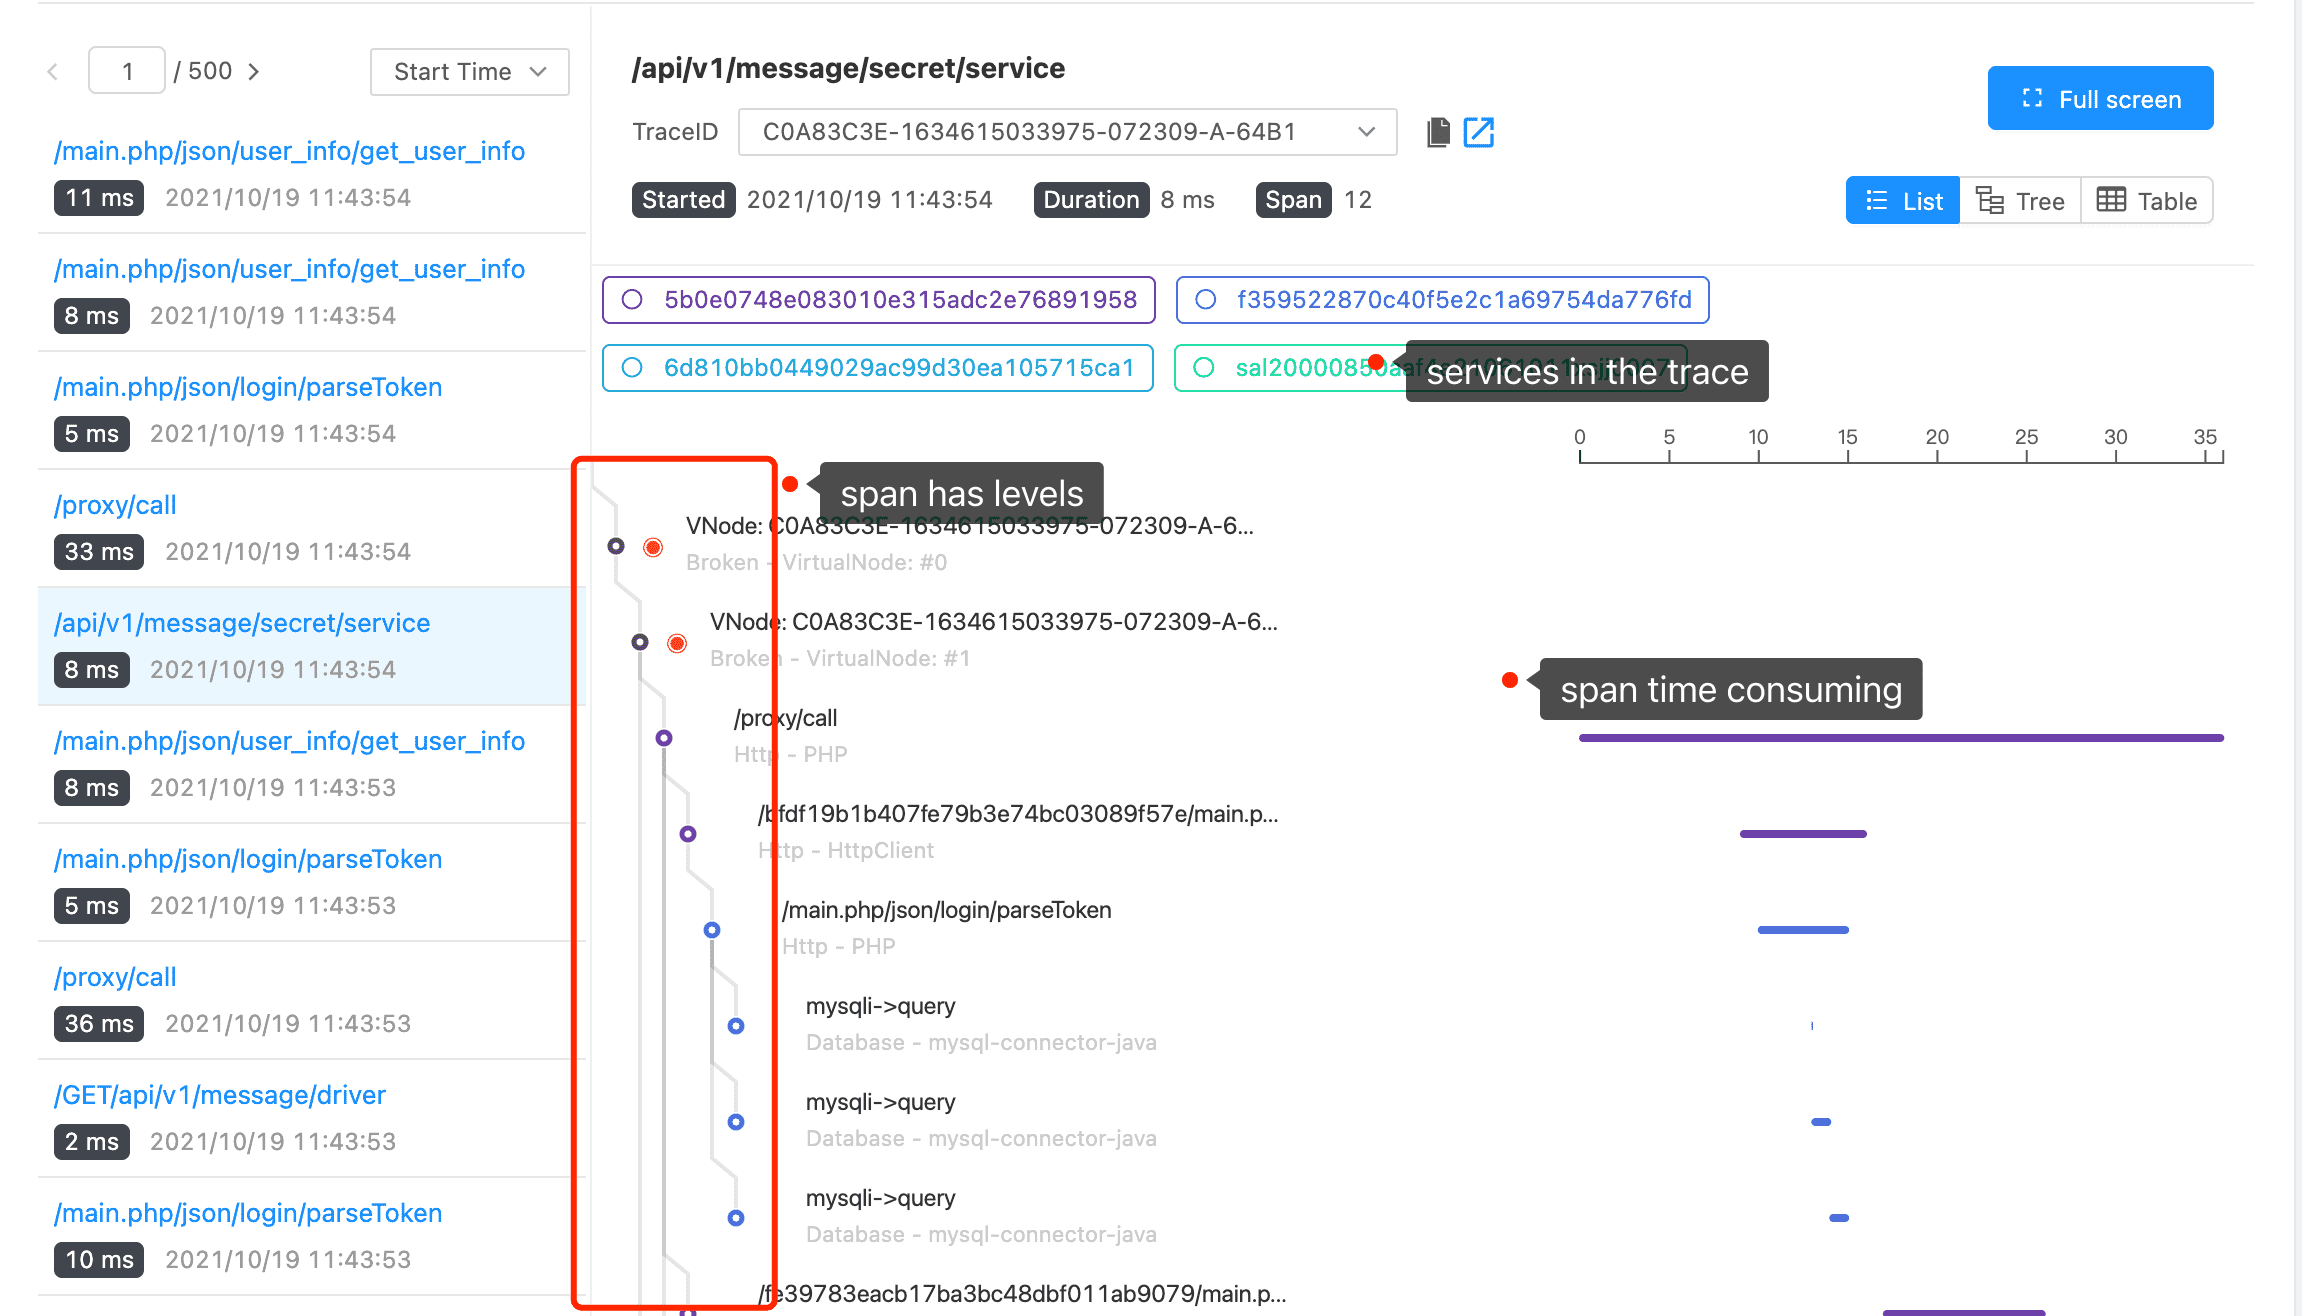
Trace list
As shown in the figure above, we can easily see
- Parent child information of each span under this link
- Intuitively view the time-consuming situation of each span to facilitate the positioning of high time-consuming span
Hover over the corresponding span to see the time-consuming details of the span:
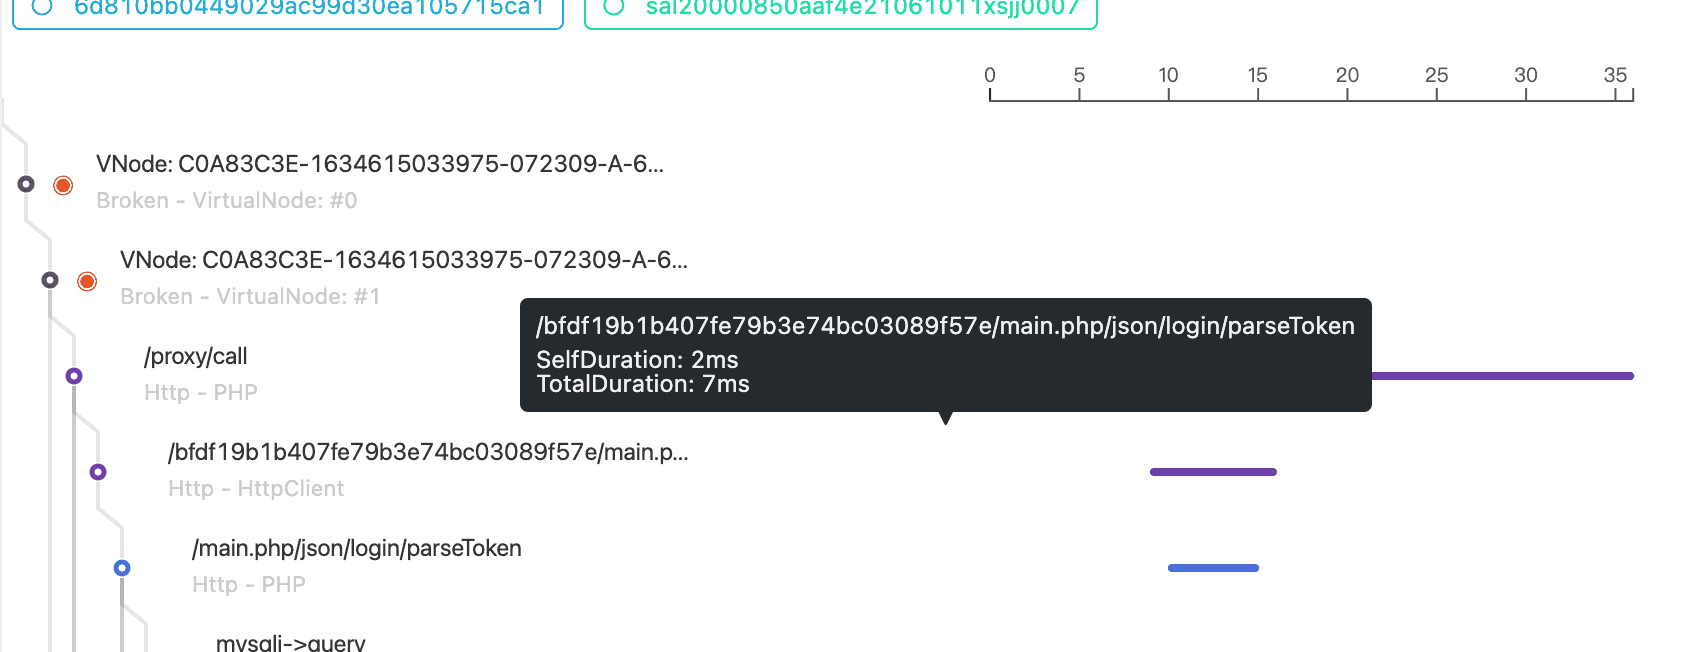
Hover the mouse span to view the span time-consuming details
At the same time, we can click on the span to see more information about it:
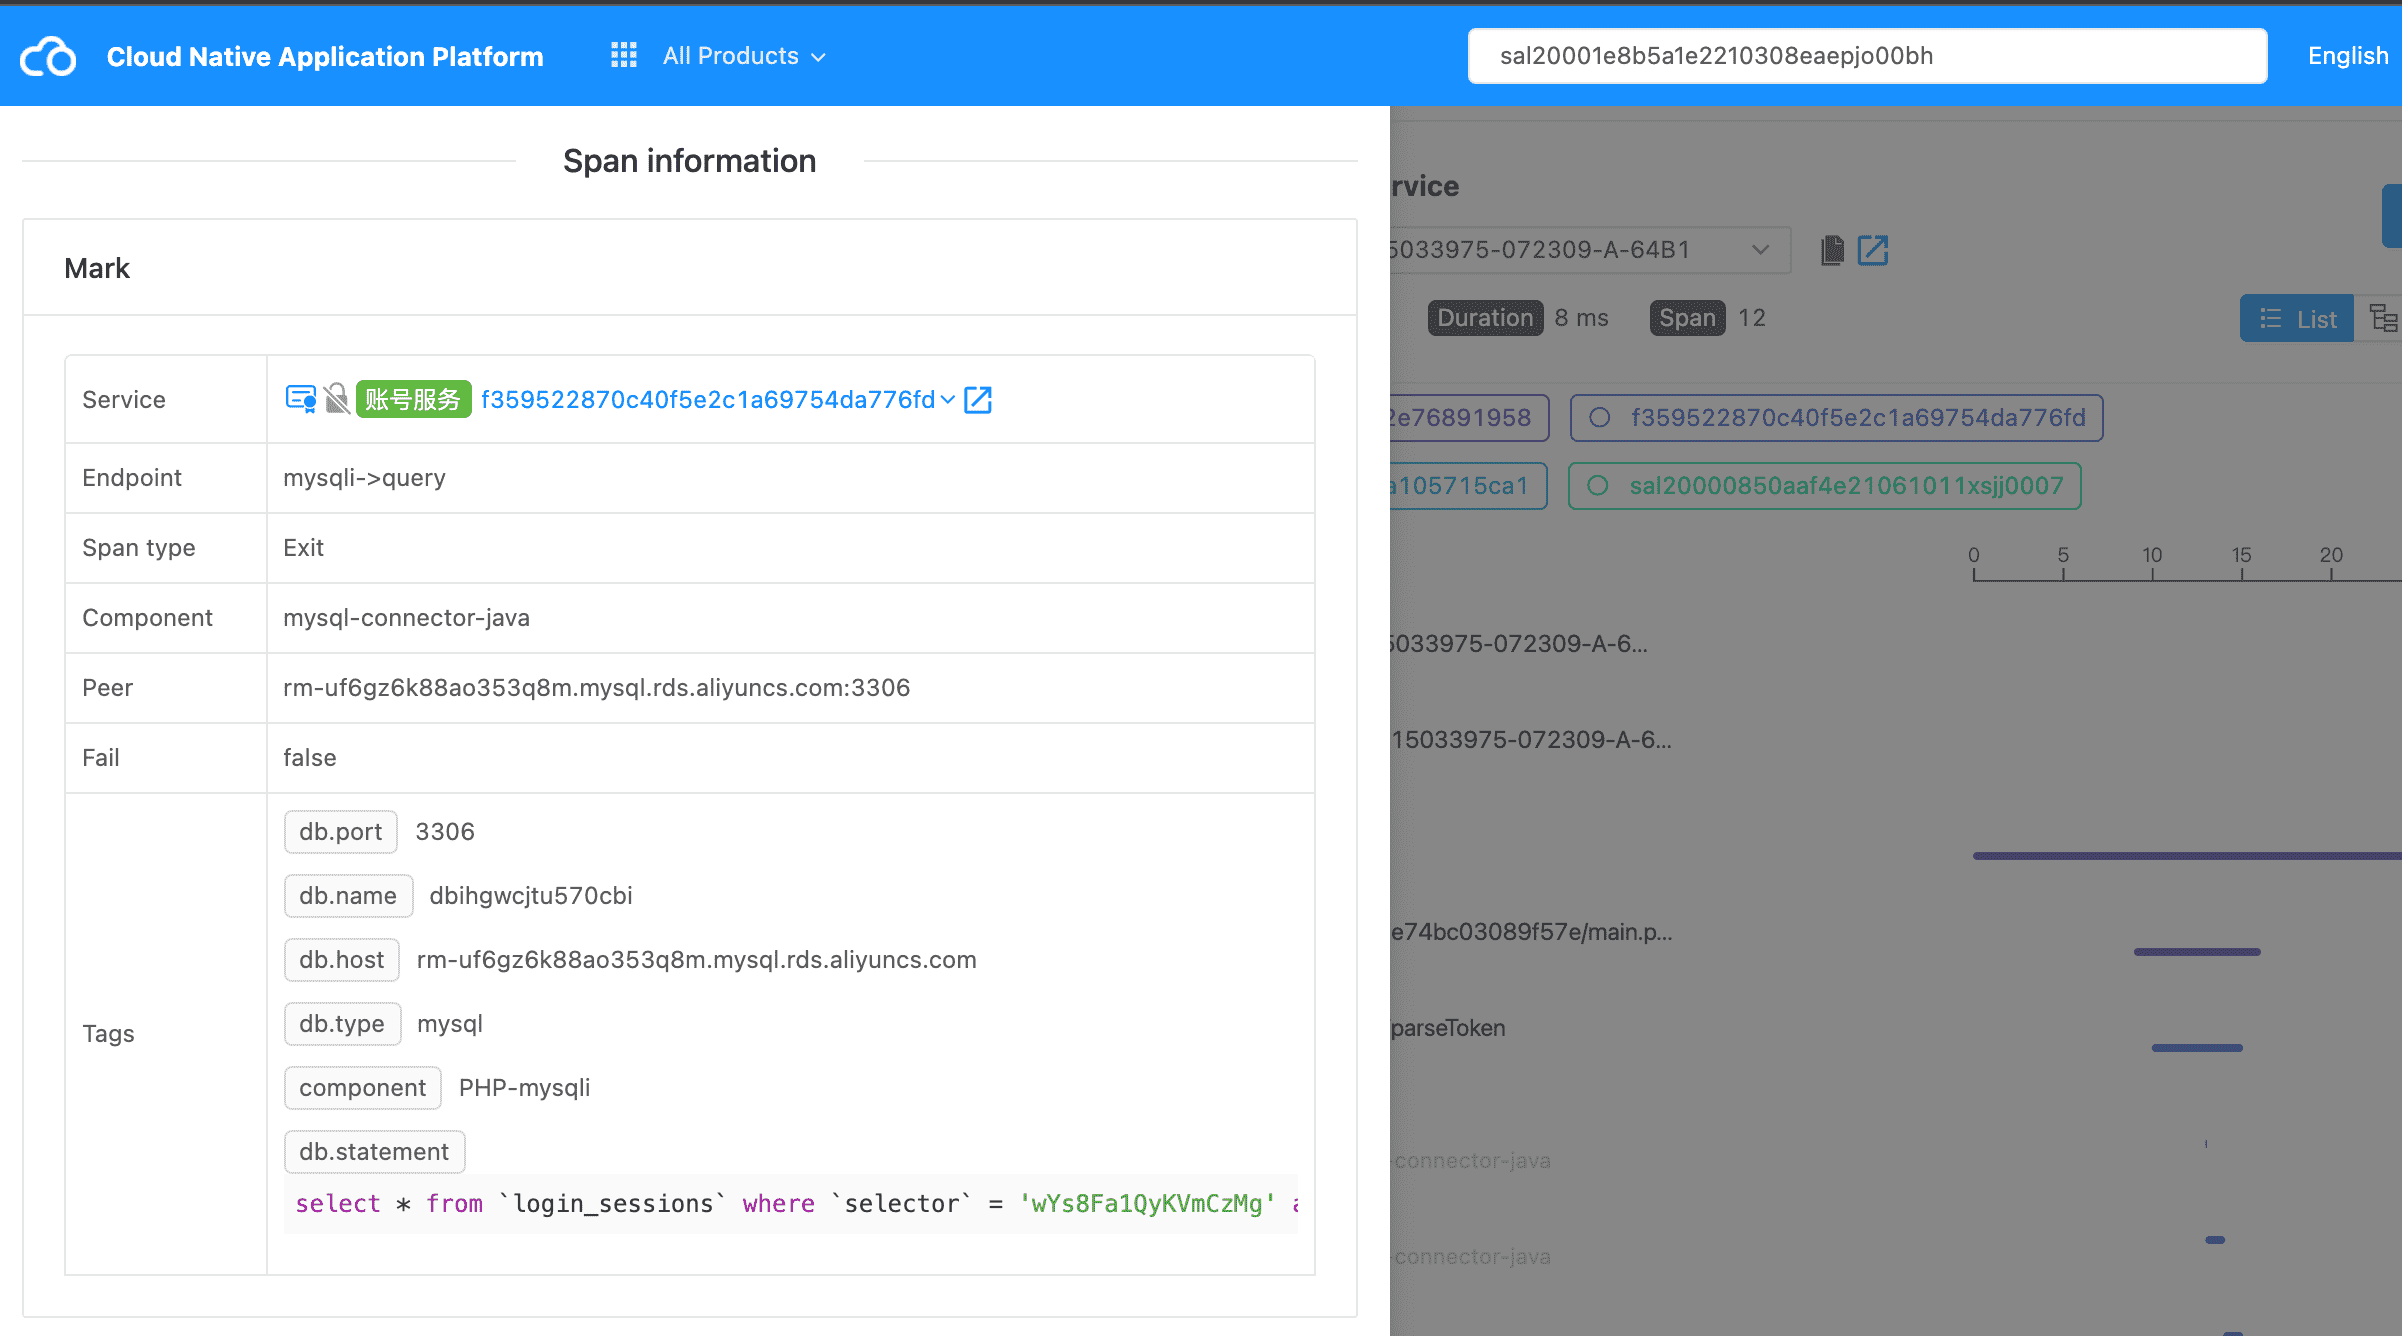
Click on the span to see details
In the details of “span”, we can see more information about the span, and different information can be displayed for different span components, such as:
- For MySQL components, we can view database connection information, SQL Statement, etc.
- For CURL components, we can see peer information
Tree #
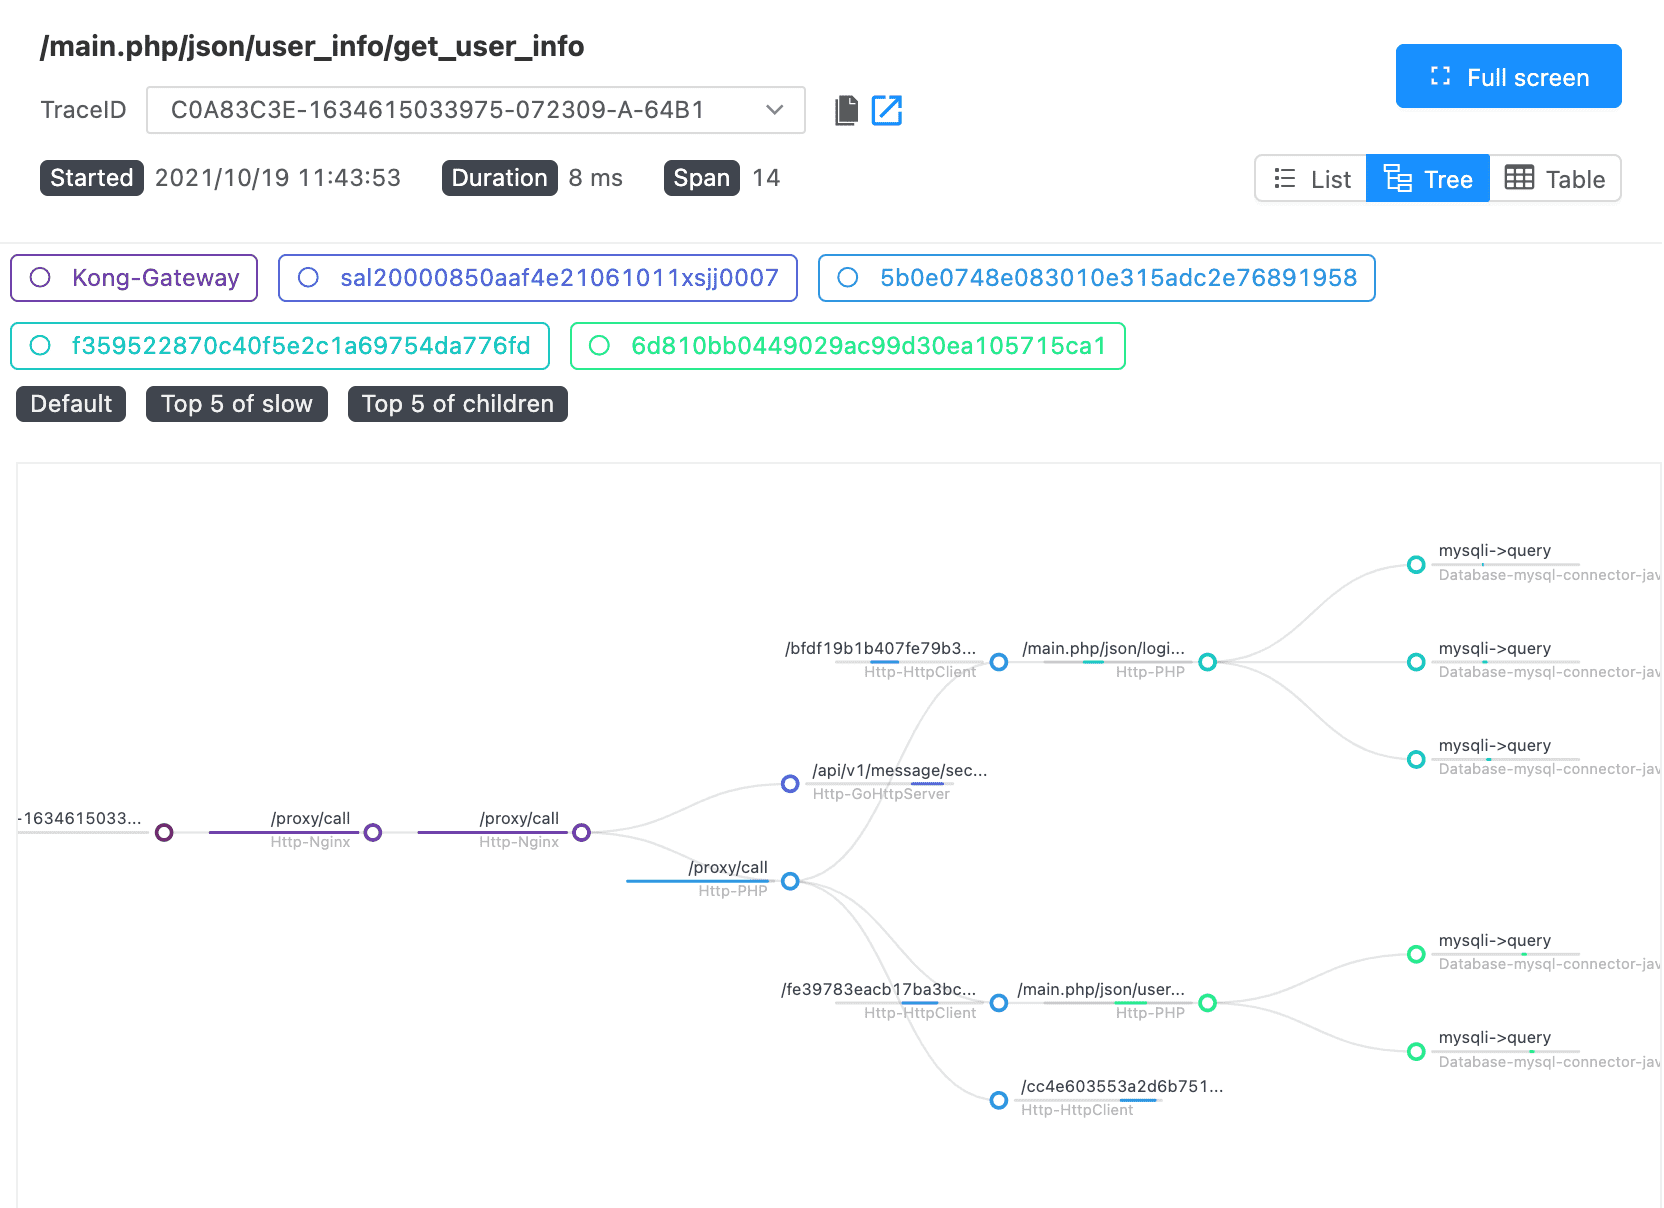
After switching to Tree information, we can view the link information in Tree mode. Likewise, we can hover or click on the span to see more information.
Table #
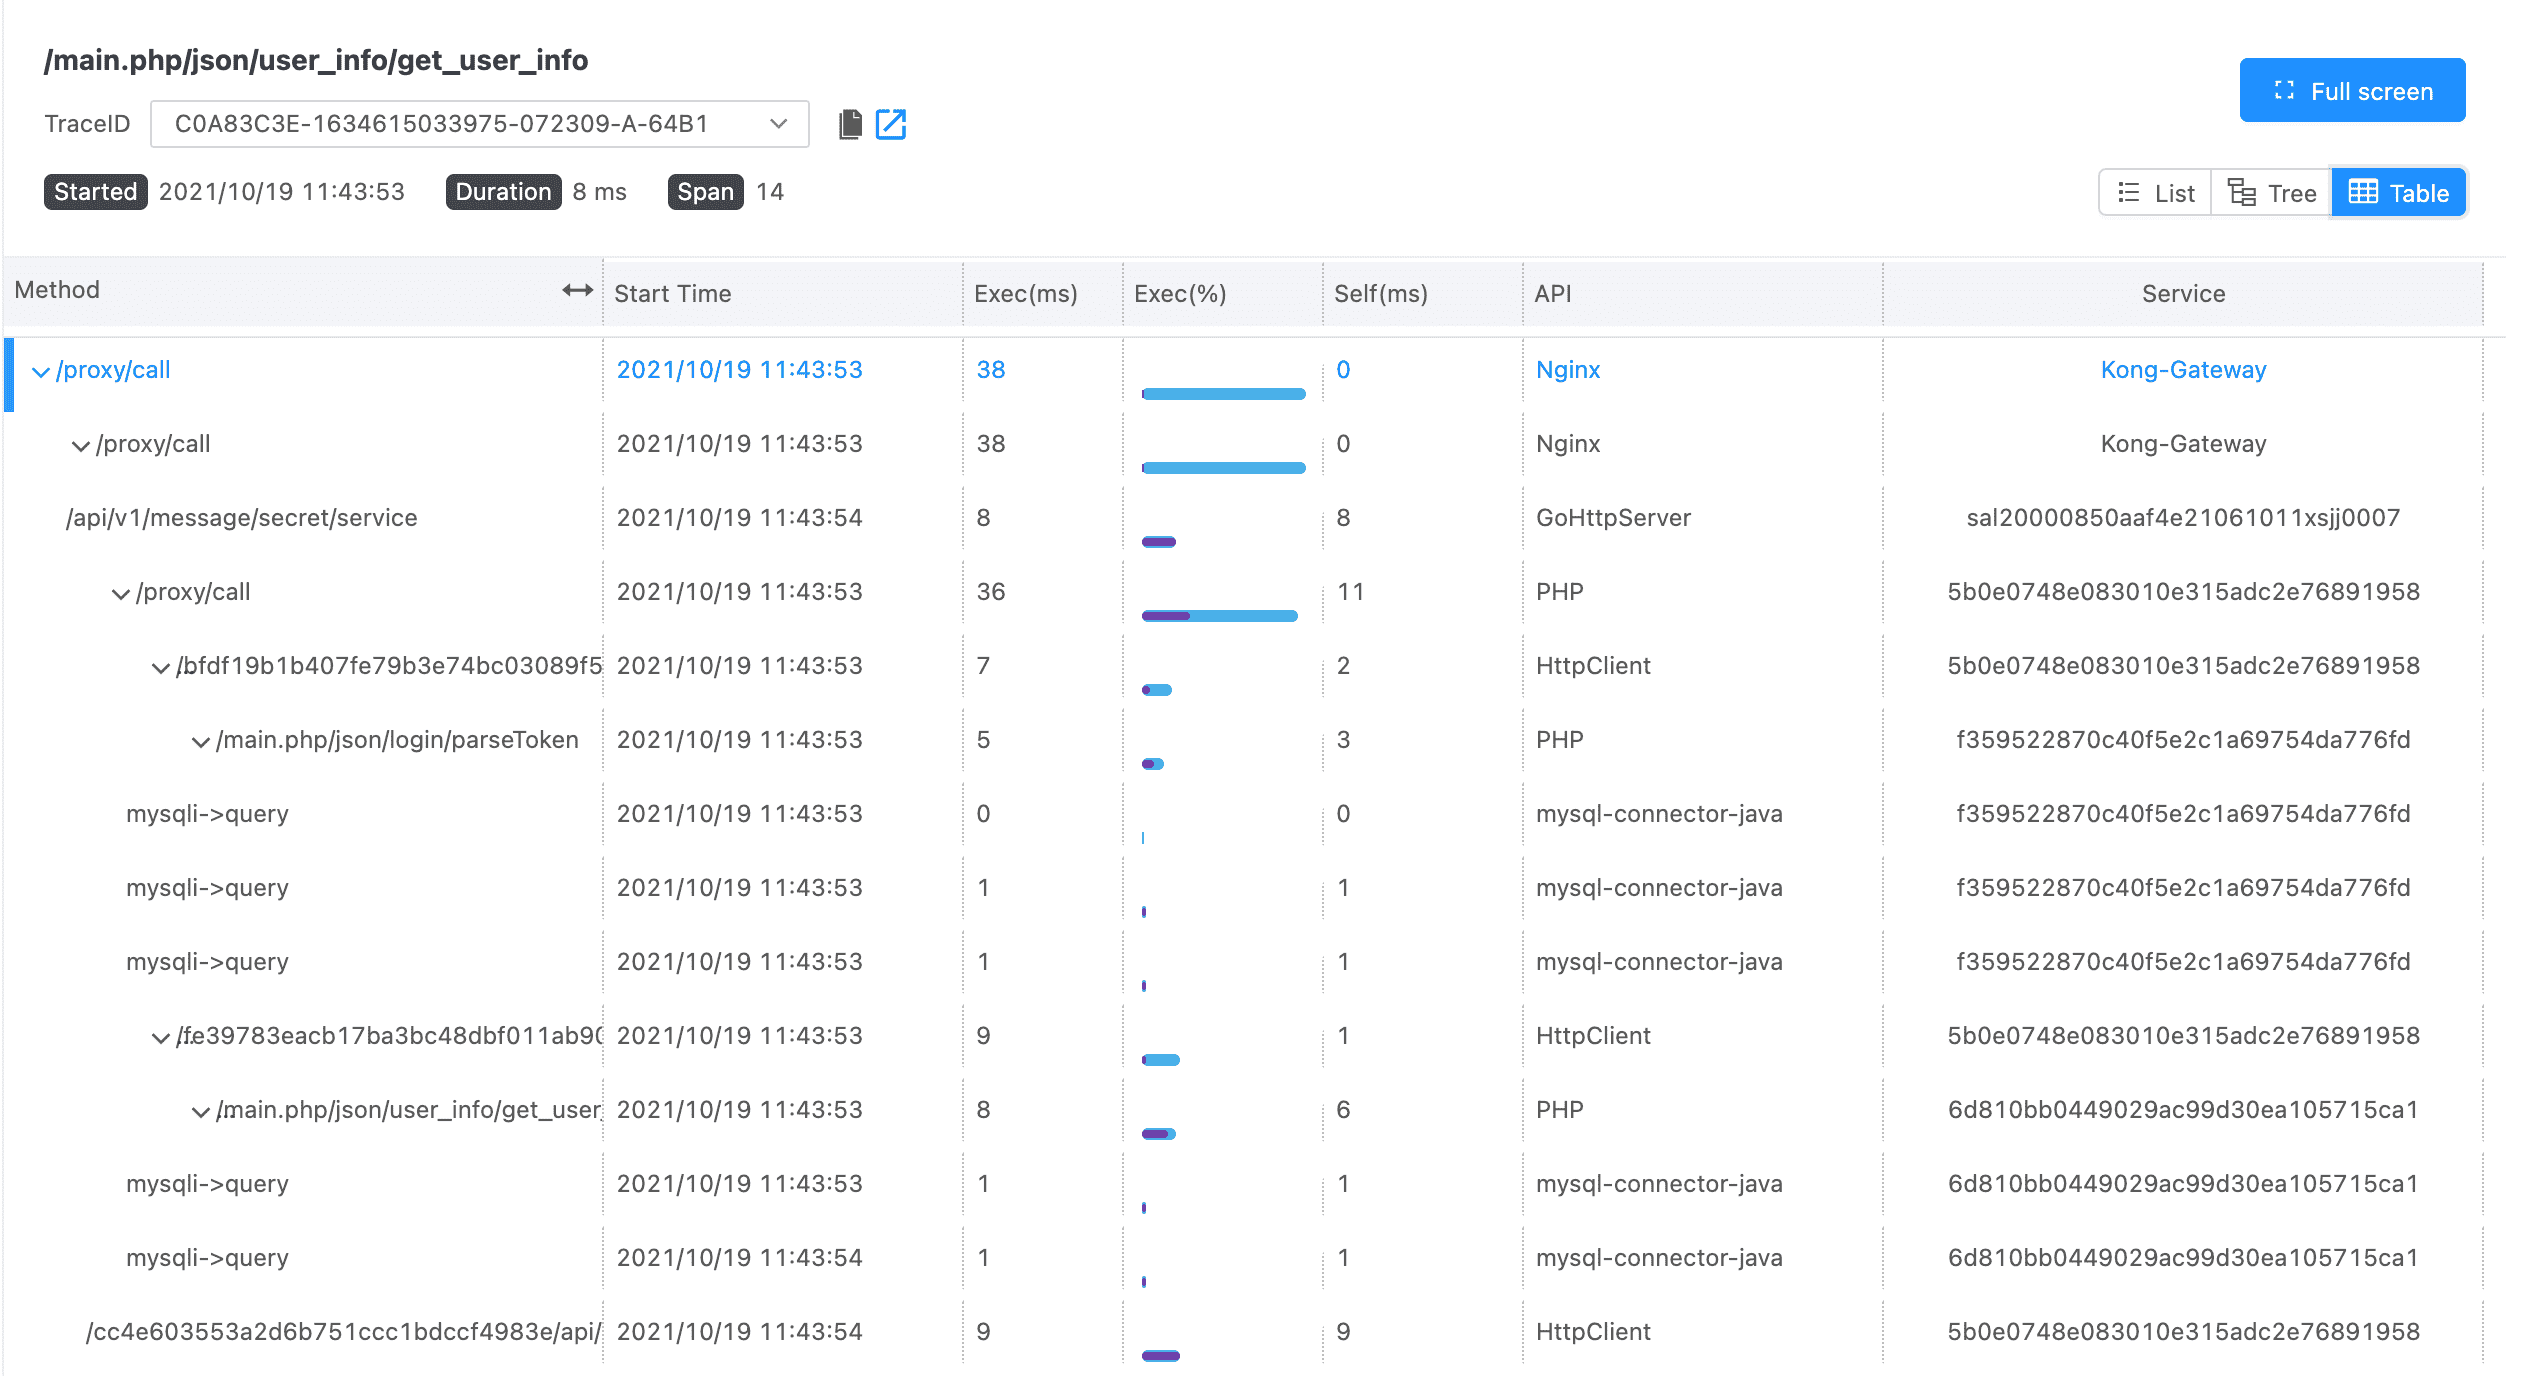
Switching the tree structure allows us to have a table view of the link information. Similarly, click each span to see more span information.