Dashboard #
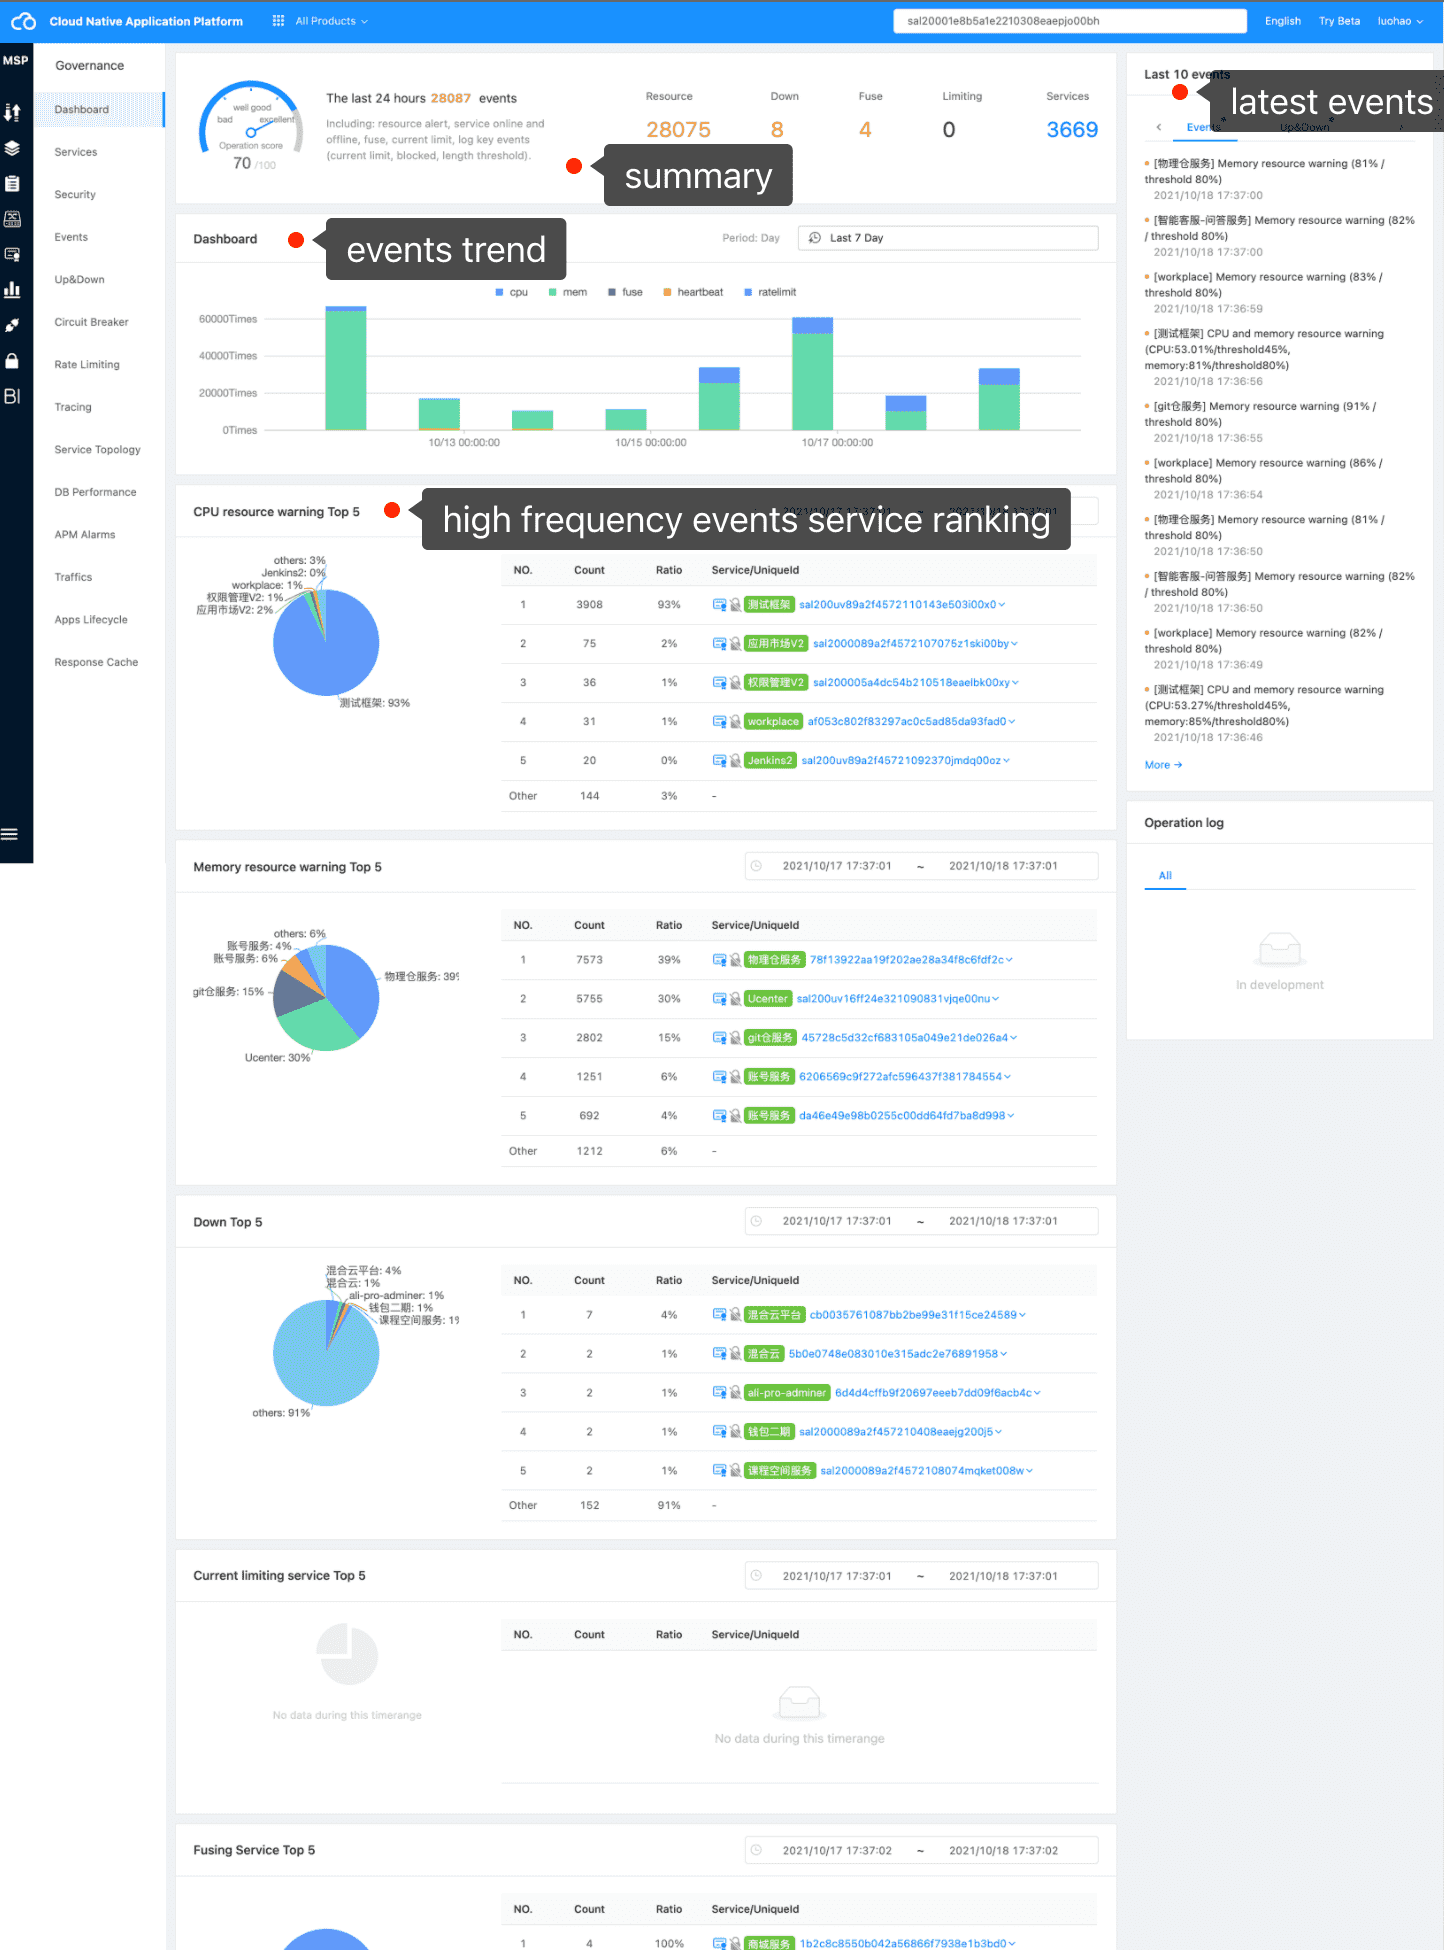
Taking “service” as the dimension, the governance center carries out service information statistics, operation state observation, governance strategy adjustment, etc. Through the “Overview” module, we can see the general operation of the whole platform services, including
- Overview of current events, such as whether there have been noteworthy events in the near future.
- Governance event overview is used to analyze the occurrence of events within a specified time.
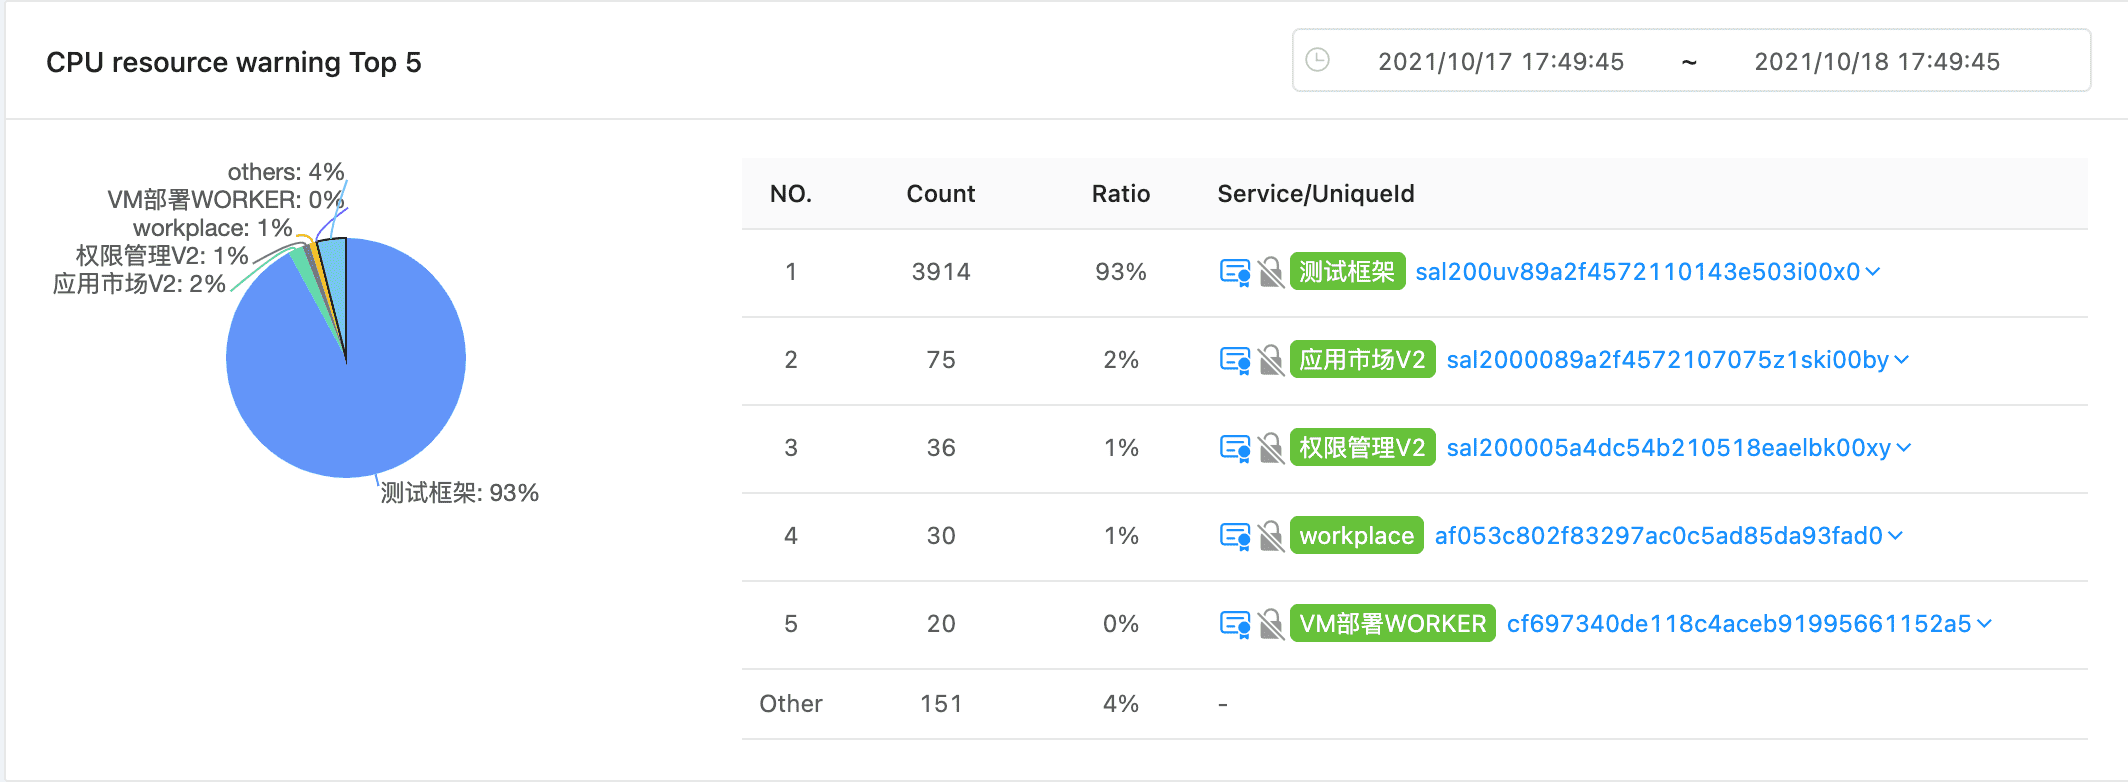
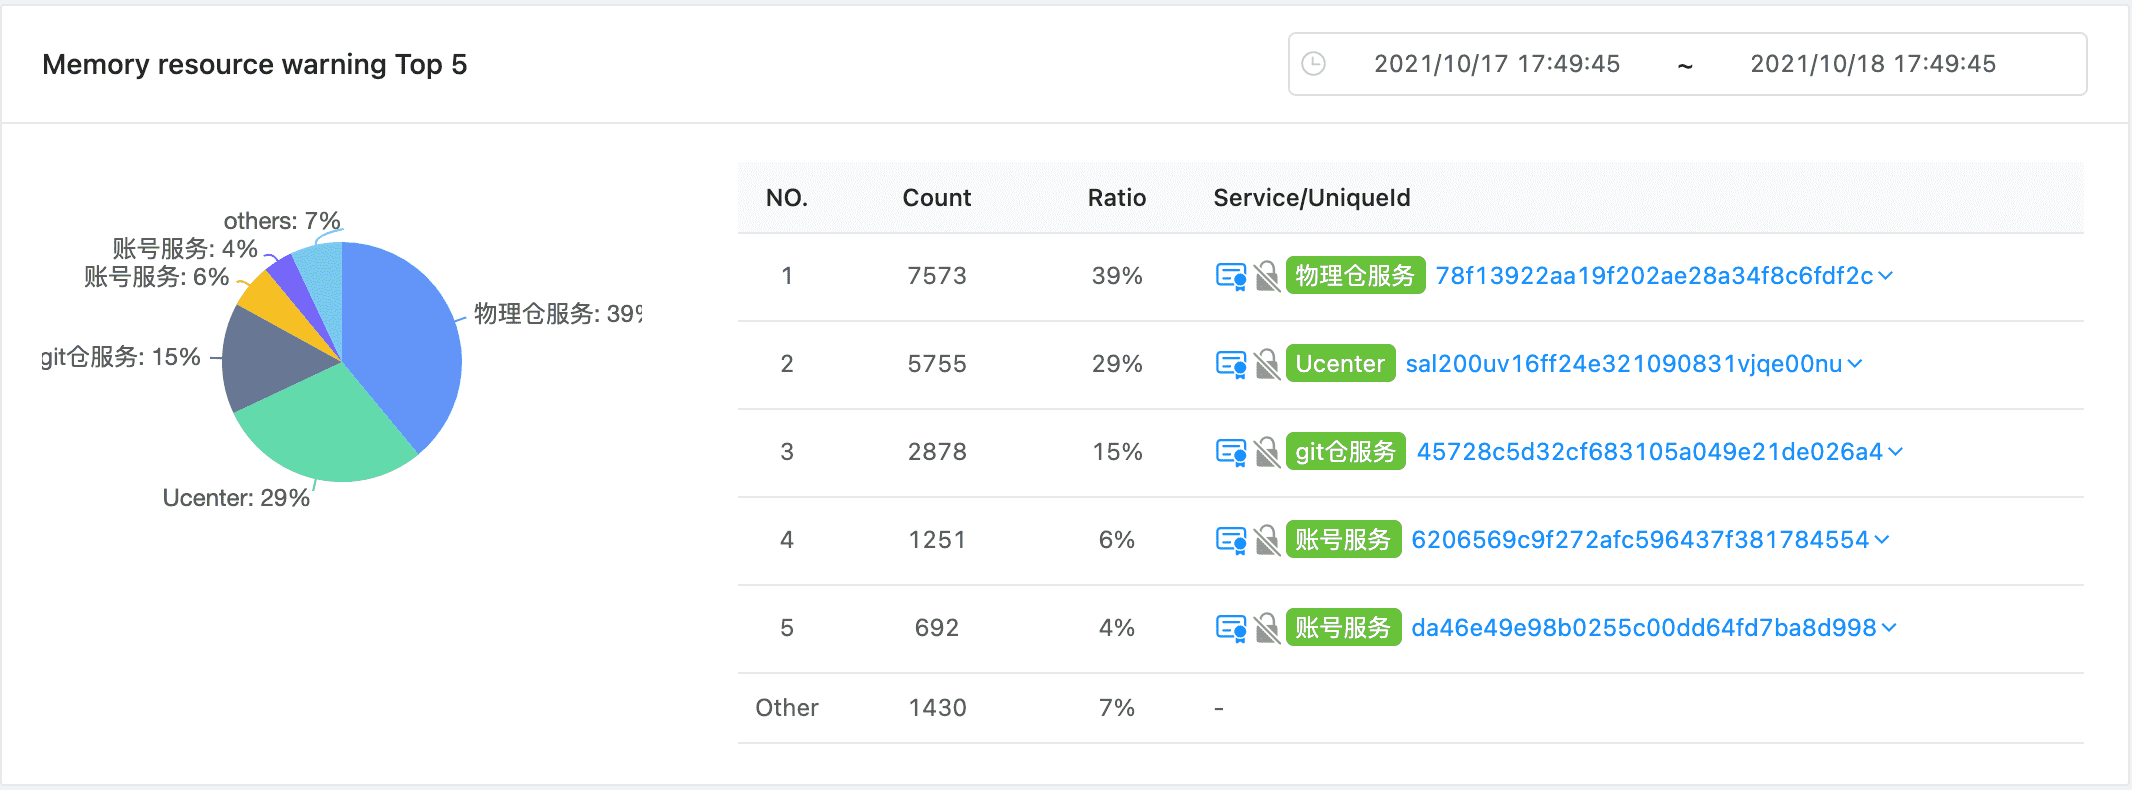
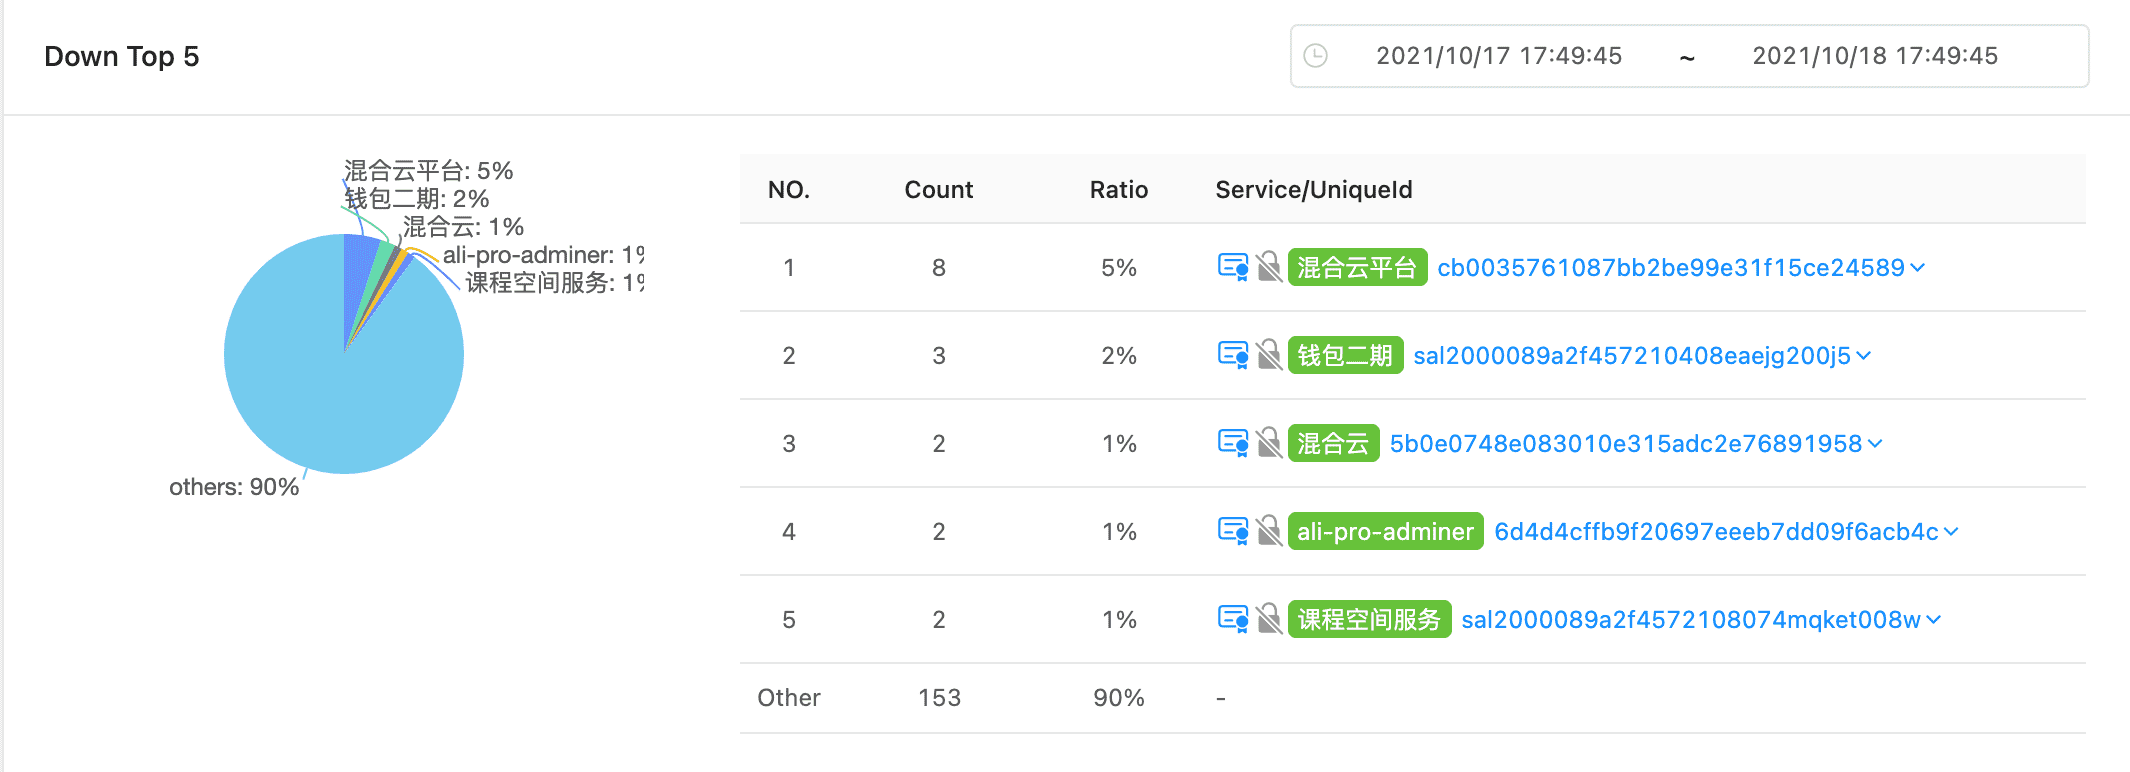
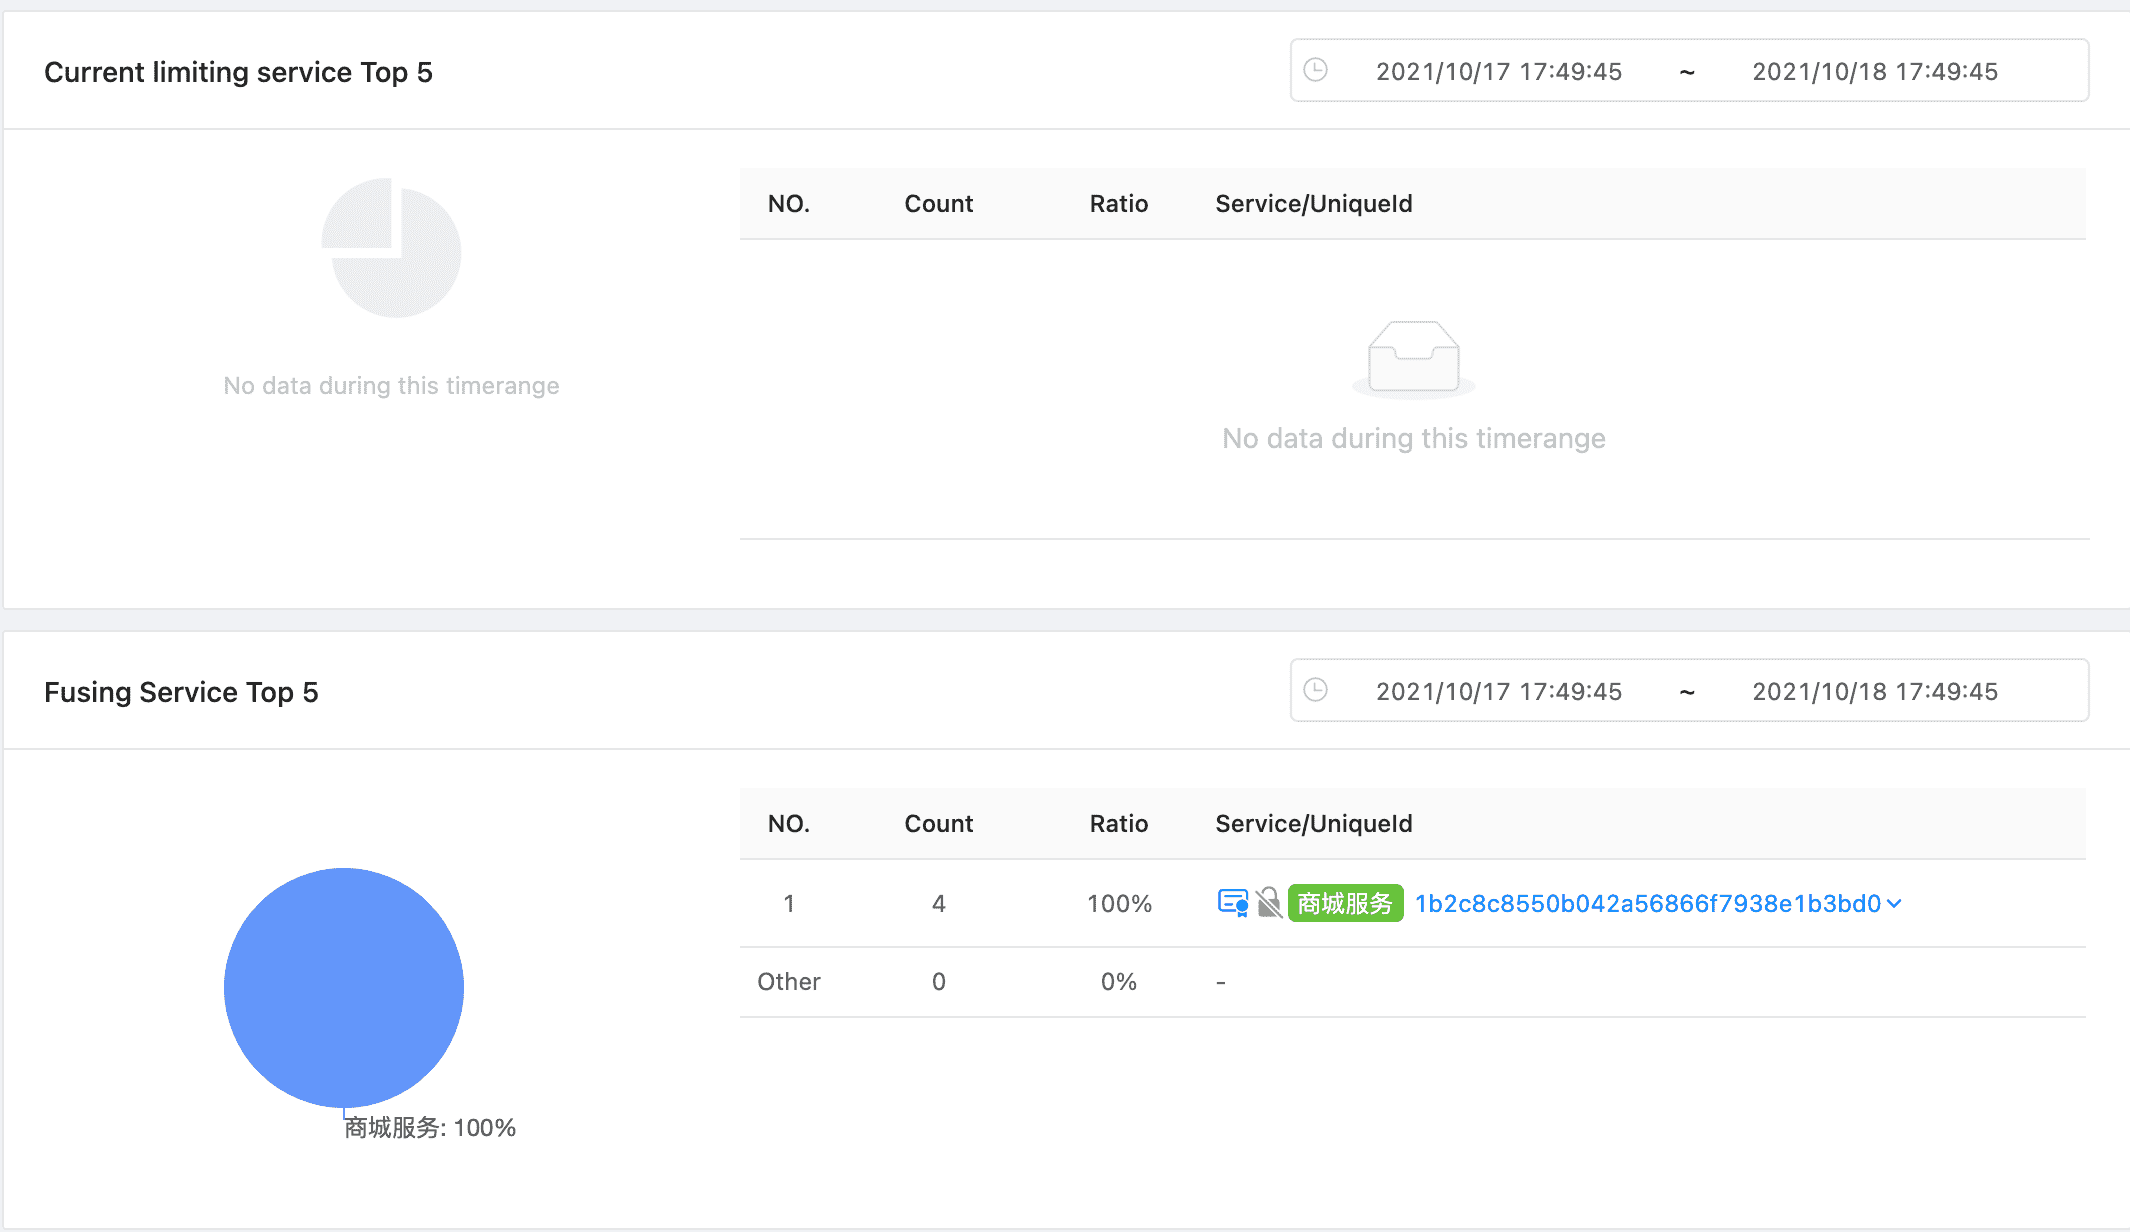
- High frequency event service ranking is used to locate the services with frequent early warning. Generally, such services need to be focused. Current contains
- CPU resource alert ranking
- Memory resource alert ranking
- Service offline ranking
- Current limiting service ranking
- Fuse service ranking
Best Practice #
- After entering the Governance Center, pay attention to the pending events of the operation overview, that is, the red part of the page. Click each event indicator to further troubleshoot the problem.
- Through the governance overview, we can view the governance event trend of the system. We can check whether it has regularity to assist in troubleshooting, such as whether events are always triggered at a certain point in time.
- Through several topn cards, we can locate the bottleneck service.
- After locating the bottleneck service or time rule, we can set governance rules for specific services. At present, the supported service governance includes: circuit breaker and current limiting.
- When removing obstacles, keep in mind the three pillars of service telemetry: logs, traces and metrics. Effective combination can achieve twice the result with half the effort. Tracks focuses on the upstream and downstream relationship of the service. Metrics displays the specific performance indicators of the service, such as service load and service delay. Logs records the more detailed situation of the service at a specific time point.
An overview of the entire module is as follows:
Summary #

The number of events in the last 24 hours and the specific number of various events are listed here. By clicking the specific value, we can view more event information.
Dashboard #
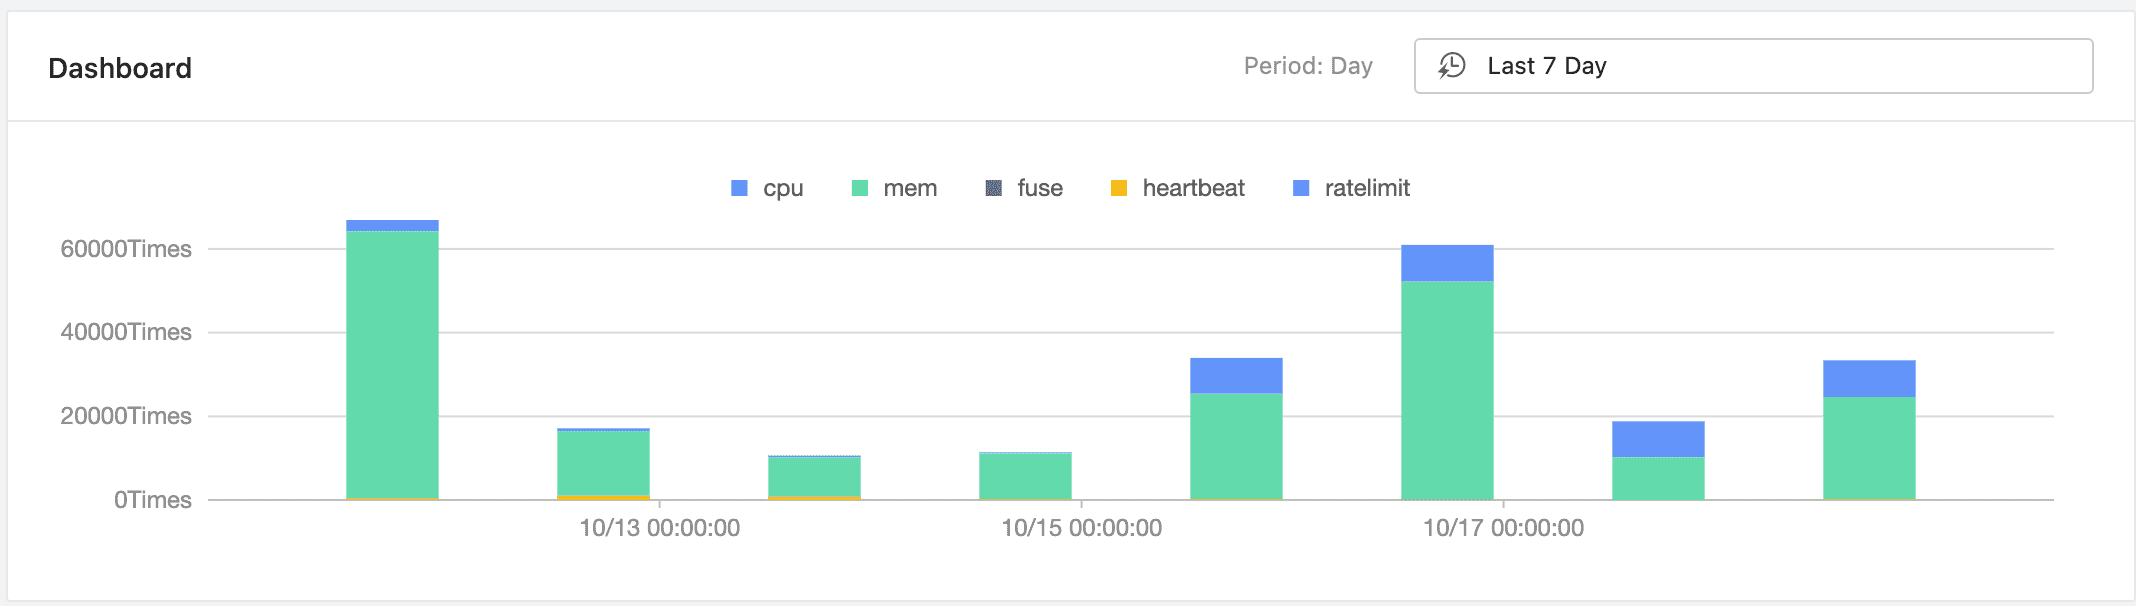
The governance overview summarizes the distribution of various events at recent time points, which can facilitate us to further view the time distribution law of relevant events and further locate the problem.
Resource Events TopN #
By ranking the services triggering the alert by topn, we can locate the “bottleneck services” or “services that need attention”. This can facilitate our targeted service governance.
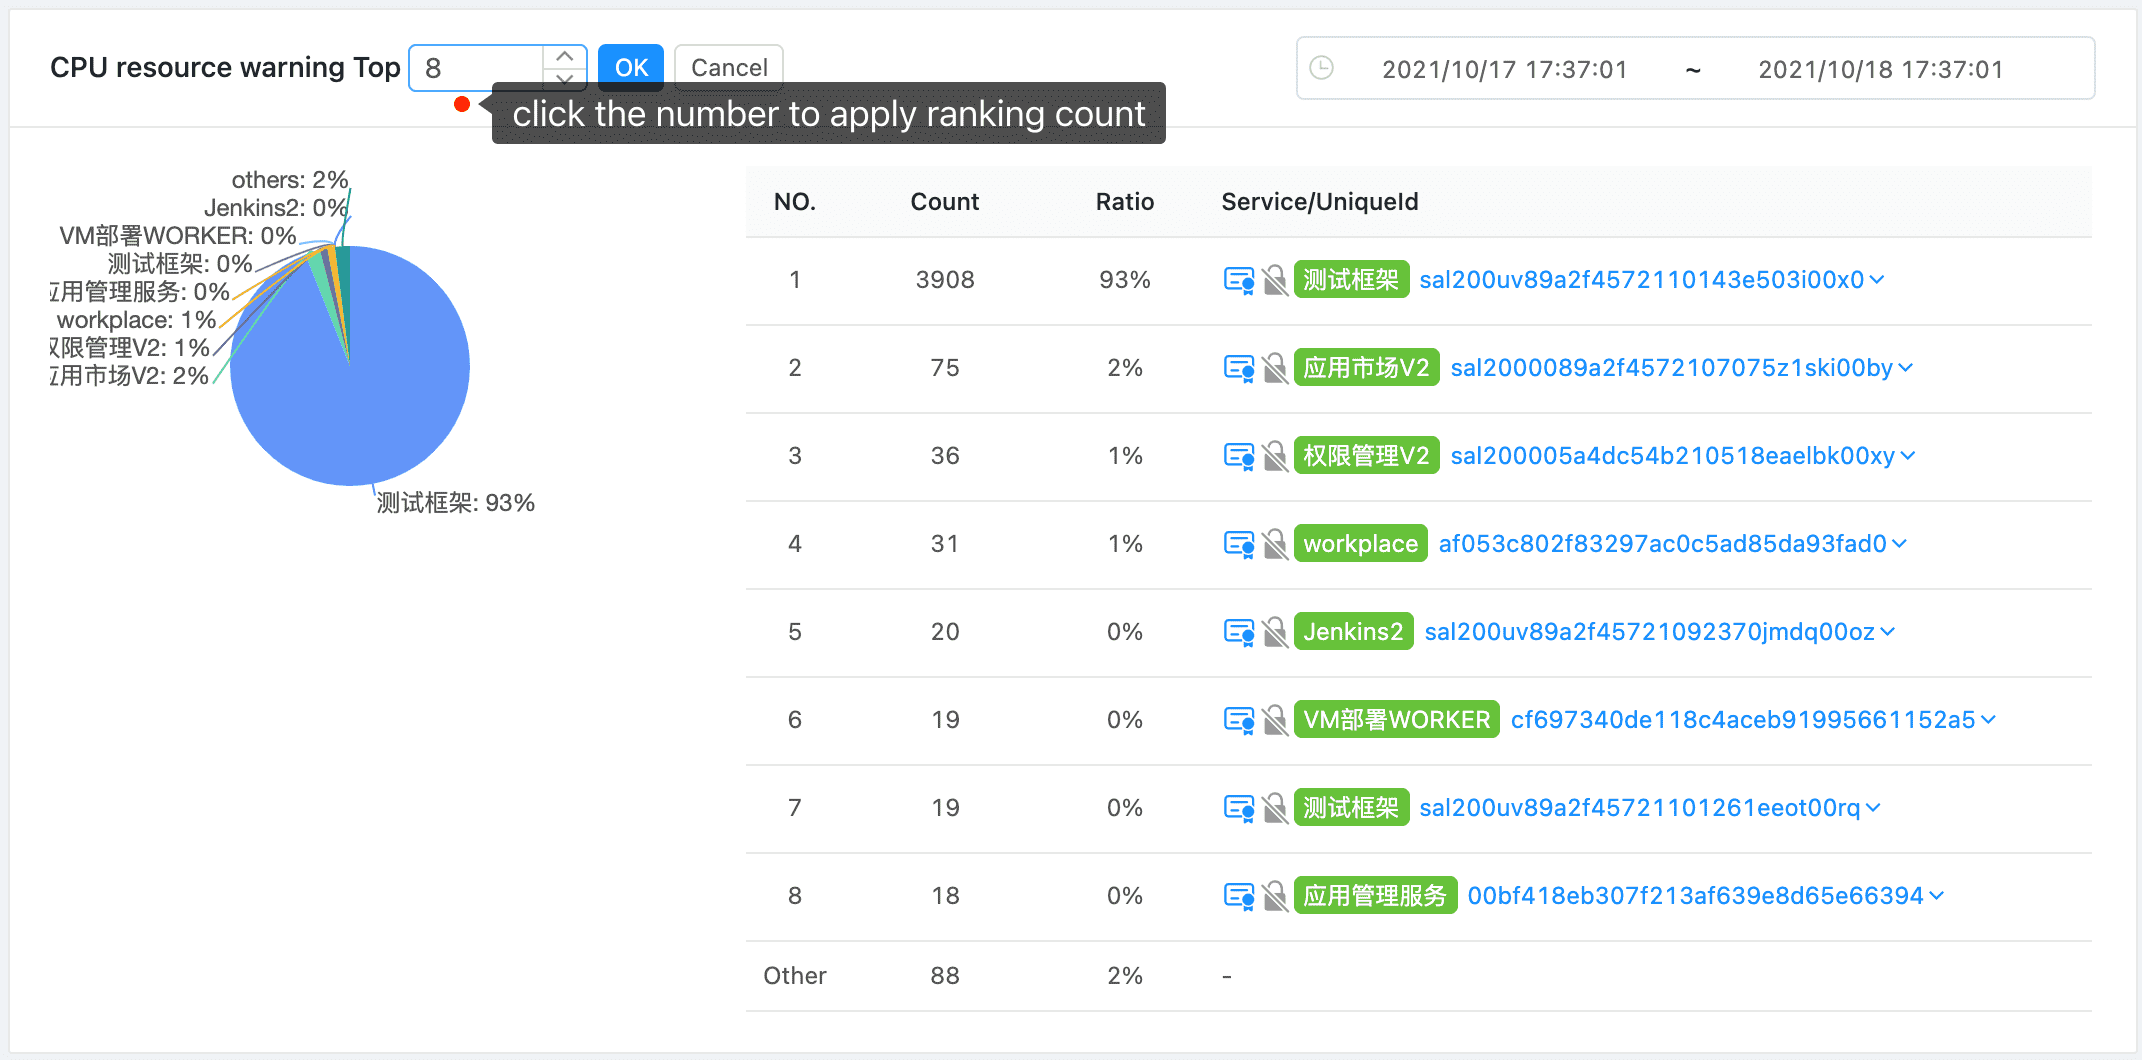
Change the specific number of topns
The following are the specific supported topn indicators, including:
- CPU resource alert ranking
- Memory resource alert ranking
- Service offline ranking
- Current limiting service ranking
- Fuse service ranking