Custom Metrics #
What can it do #
Description #
MSP custom monitoring function provides the ability of custom timing monitoring based on service granularity.
Here is a supplementary description of the key words:
- service granularity:That is, the monitoring function provided serves a single service (distinguished by unique_id). The monitoring of each service is independent of each other, and different monitoring shall be set according to its own service characteristics.
- custom:That is to provide monitoring indicators controlled by the access party. For example, the order team can send the monitoring data related to the order quantity, and the user team can send the monitoring data related to the number of registered users to monitor their own service characteristics, key business indicators and performance indicators.
- timing monitoring:That is, the data sent has “timing” characteristics. The index sent each time represents the value of the sending time, so we can construct the index data based on the time range to analyze the trend or characteristics of the index.
Examples #
Next, we will list several classic scenarios that can be used for custom monitoring. Let’s see the energy that custom monitoring can exert.
1. Monitor the orders per minute of the mall #
In addition to the basic system indicators (such as memory indicators and CPU indicators), we should also pay attention to its business indicators. For a normal and stable system, the overall business characteristics of its external performance should be regular.
For example, under normal circumstances, the order volume of a normal mall order service should fluctuate in a stable range. Order volume can be used as a key business indicator of the stability of this service.
We need to be vigilant when the order volume fluctuates violently. For example, when the order volume surges, is it because the marketing team is promoting or is it caused by the wool party. When the order volume drops suddenly, is it caused by the release of a new version or the exception of dependent third-party services.
Based on the above possible situations, in order to ensure the stability of business and improve the confidence of our team system, we need to monitor the order volume.
Code Example
// Create a send key, new_order is used to indicate the new order quantity at the time of sending

function newOrder(){
  // Send data to MSP when processing new order logic
  $metrics->sendSimpleMetrics('new_order', 1);
}
Figure Example
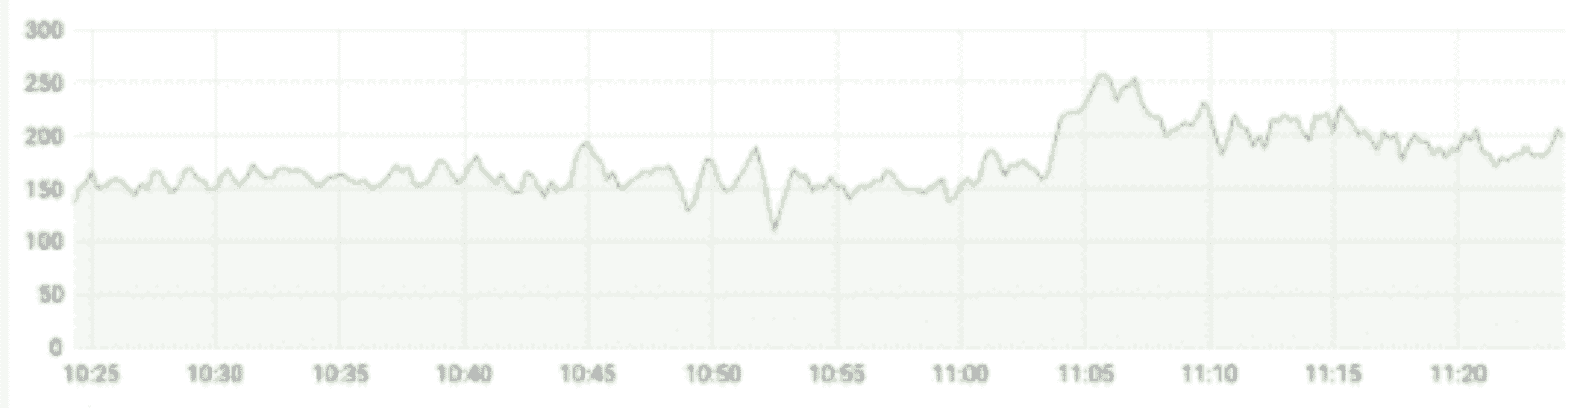
By monitoring the order quantity, MSP can automatically draw monitoring graphics similar to the above representation, improve the observability of the business system and play a great value in the following scenarios:
- When releasing new functions, observe whether it has an impact on system stability
- When conducting a marketing campaign, evaluate the value of the campaign
- Carry out automatic strategy early warning and automatic duty construction based on indicators
- User behavior portrait construction
- More scenarios
2. Analyze the processing time of key functions in the business #
The user-defined monitoring function can be applied not only in the business field, but also in the perspective of service governance.
There is a synchronous high delay processing in our system (it may be a large file processing or rely on a third-party service). In order to better observe this processing, we can monitor its processing time.
Code Example
// Create a send key func1_time_usage, used to indicate the time consumption of function func1
function func1(){
  // Get the current timestamp at the beginning of the function
  $startTimestamp = ....

  // ... It takes time to calculate the current function at the end of the function

  $metrics->sendSimpleMetrics('func1_time_usage', $endTimestamp - $startTimestamp);
}
Figure Example
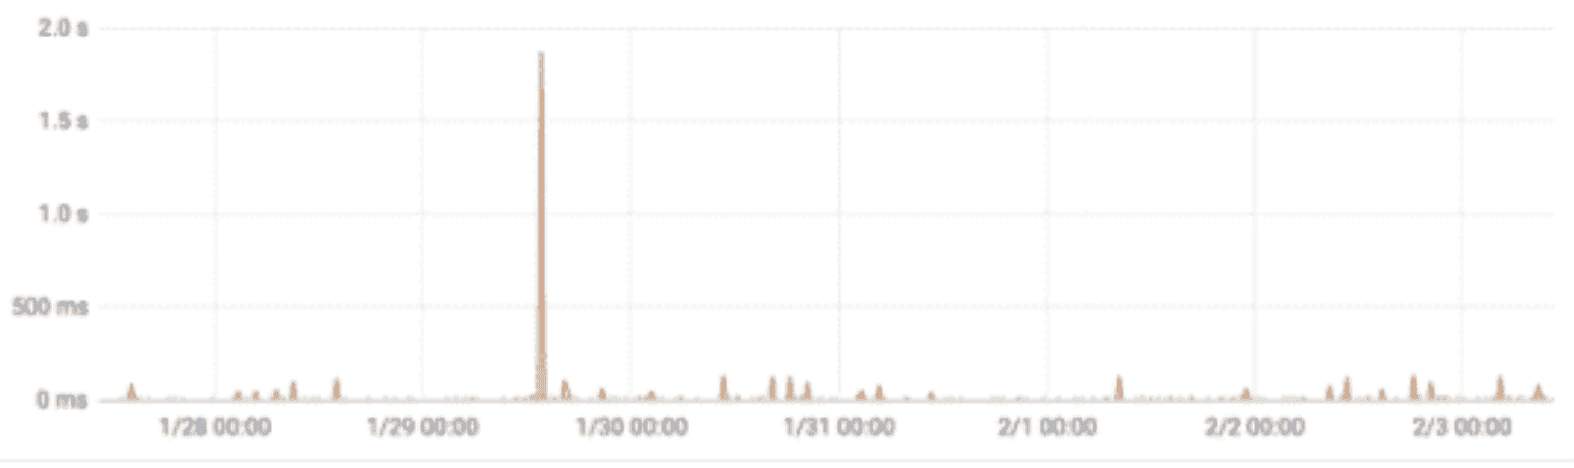
Through the monitoring of key functions, decision indicators related to service governance can be provided. At the same time, it can also be used as the basis for troubleshooting some problems.
How to use #
The access of MSP custom monitoring is mainly divided into two steps:
- Step 1: configure the sent key and chart properties on the MSP platform
- Step 2: send data using SDK
1. Configure the sent key and chart properties #
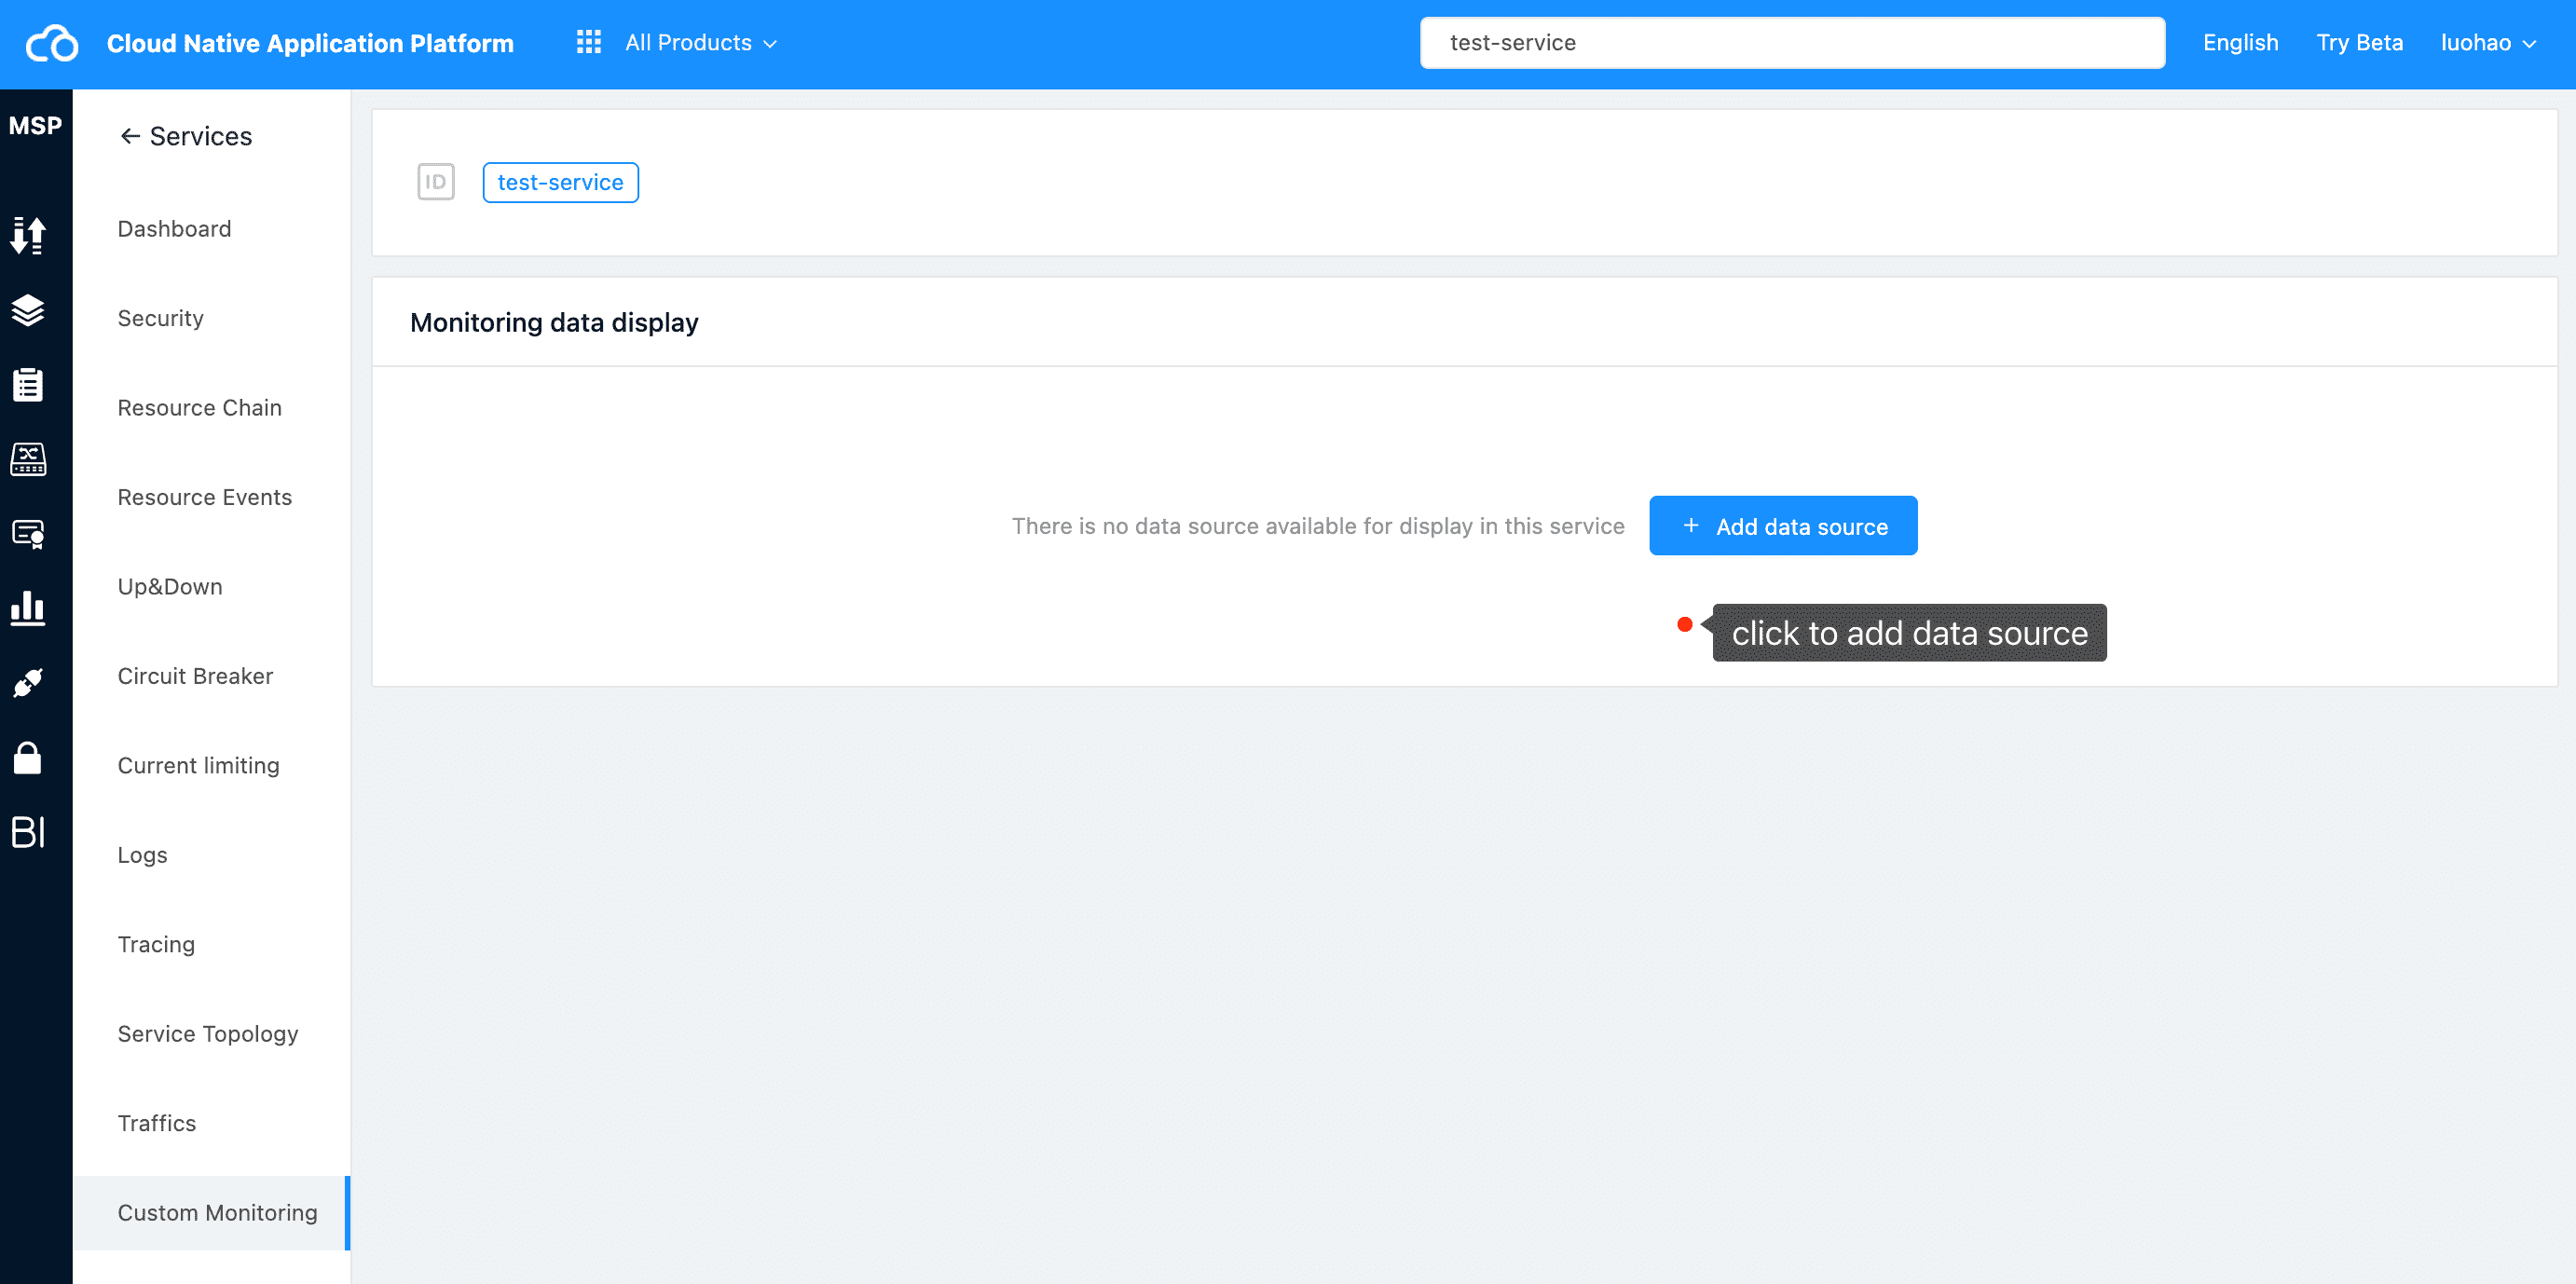
Fill in your own key and relevant instructions as required. Note the format of the key: use letters or underscores
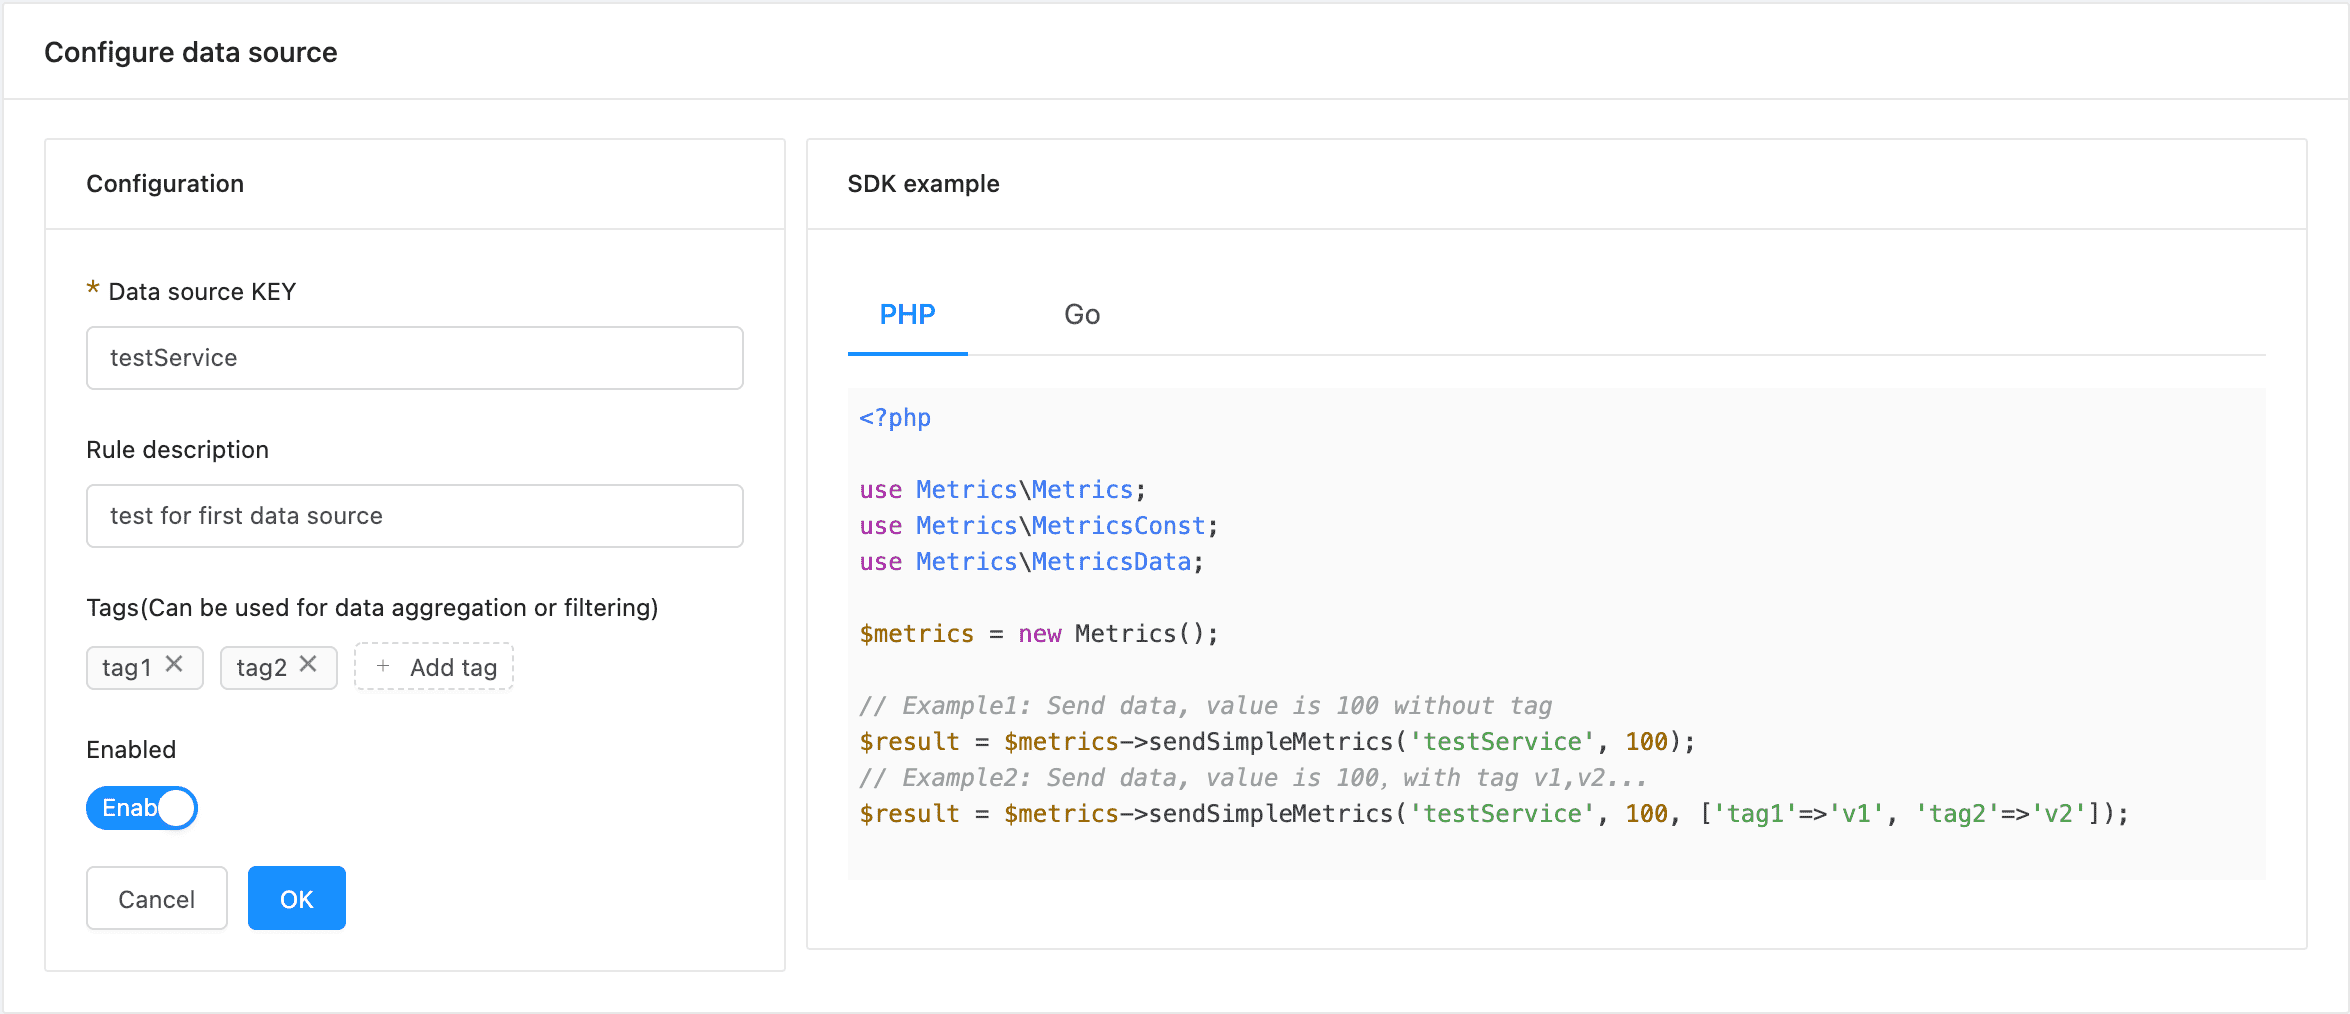
2. Send with SDK #
The SDK of PHP and go language is provided, which can be used directly.
PHP SDK
<?php

use Metrics\Metrics;
use Metrics\MetricsConst;
use Metrics\MetricsData;

$metrics = new Metrics();

// Example1: Send data, value is 100 without tag
$result = $metrics->sendSimpleMetrics('testService', 100);
// Example2: Send data, value is 100,with tag v1,v2...
$result = $metrics->sendSimpleMetrics('testService', 100, ['tag1'=>'v1', 'tag2'=>'v2']);
Go SDK
package main

import (
  "gitlab.oneitfarm.com/bifrost/metrics-go/client"
  "gitlab.oneitfarm.com/bifrost/metrics-go/metrics"
  "log"
  "time"
)

func main() {
  conf := client.HTTPConfig{
    Addr:                "http://localhost:8080/sidecar/metrics",
    Timeout:             time.Second,
    MaxIdleConns:        30,
    MaxIdleConnsPerHost: 30,
    IdleConnTimeout:     time.Second * 30,
  }
  metricsClient, err := client.NewHttpClient(conf)
  if err != nil {
    log.Println(err)
    return
  }

  // Example1: Send data, value is 100 without tag
  res, err := metricsClient.SendSimpleMetrics("testService", 100, nil)
  // Example2: Send data, value is 100,with tag v1,v2...
  res, err := metricsClient.SendSimpleMetrics("testService", 100, map[string]string{"tag1":"v1", "tag2":"v2"})
}
3. After the data is sent, MSP automatically draws the image #
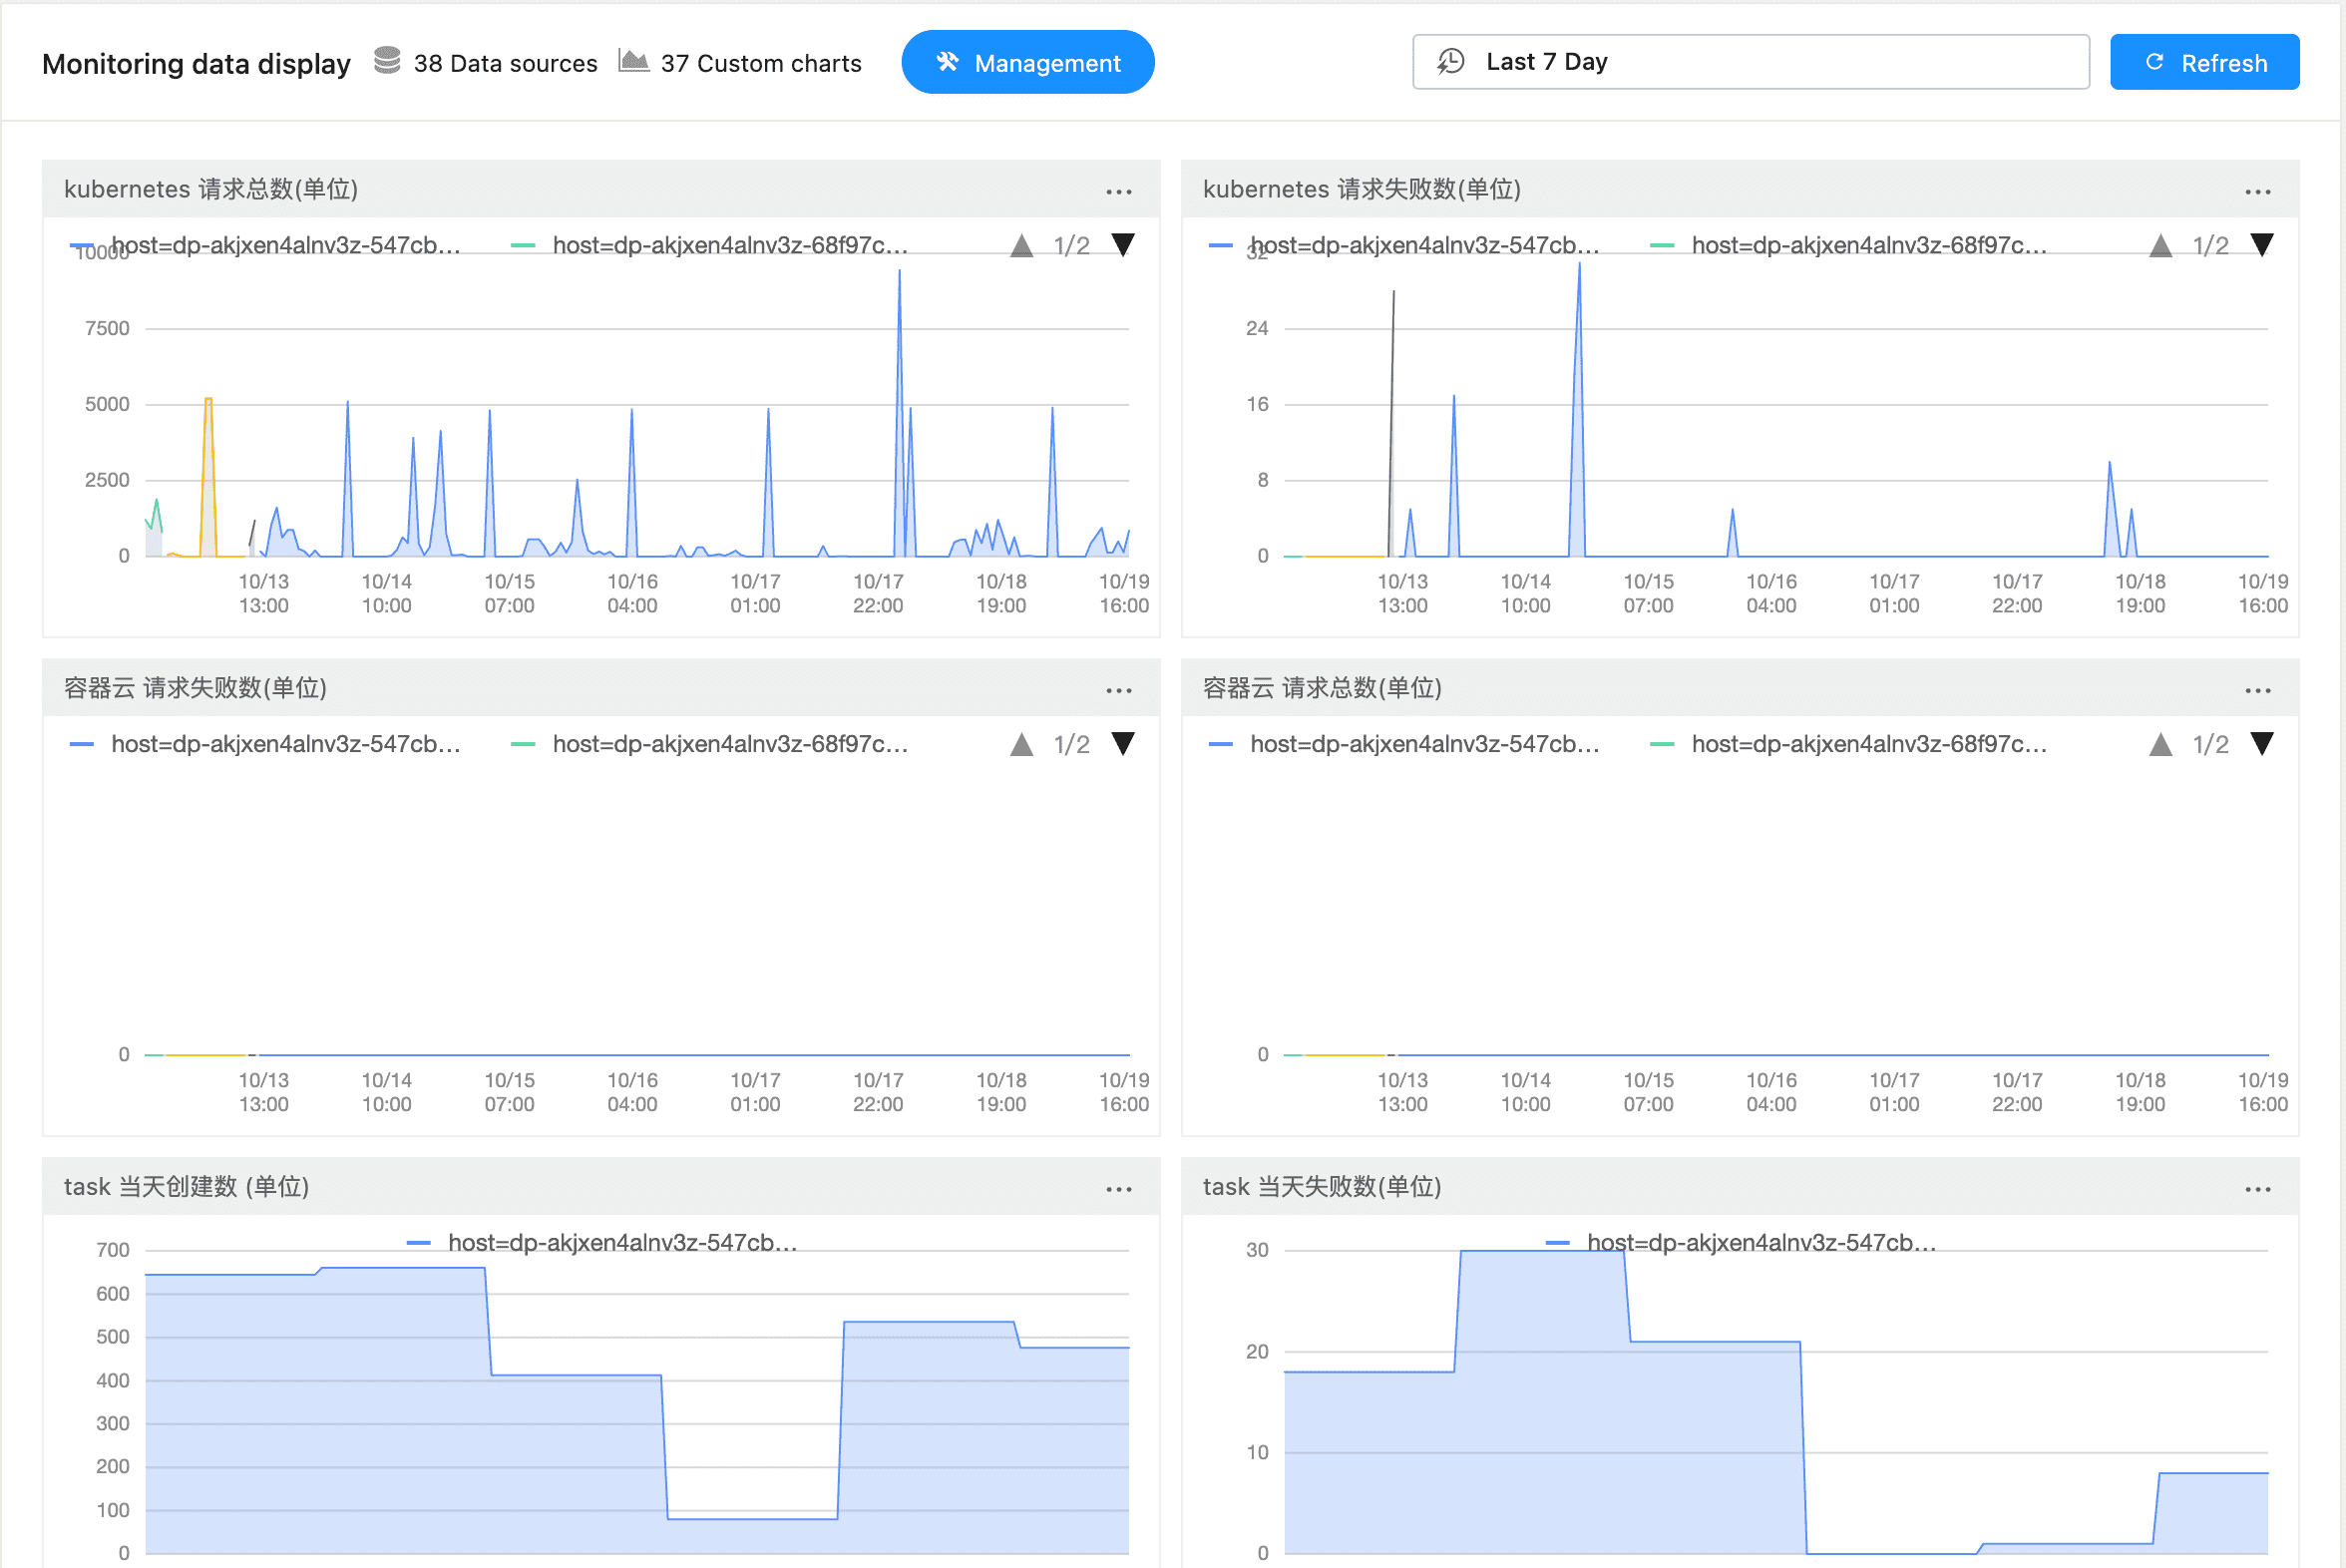
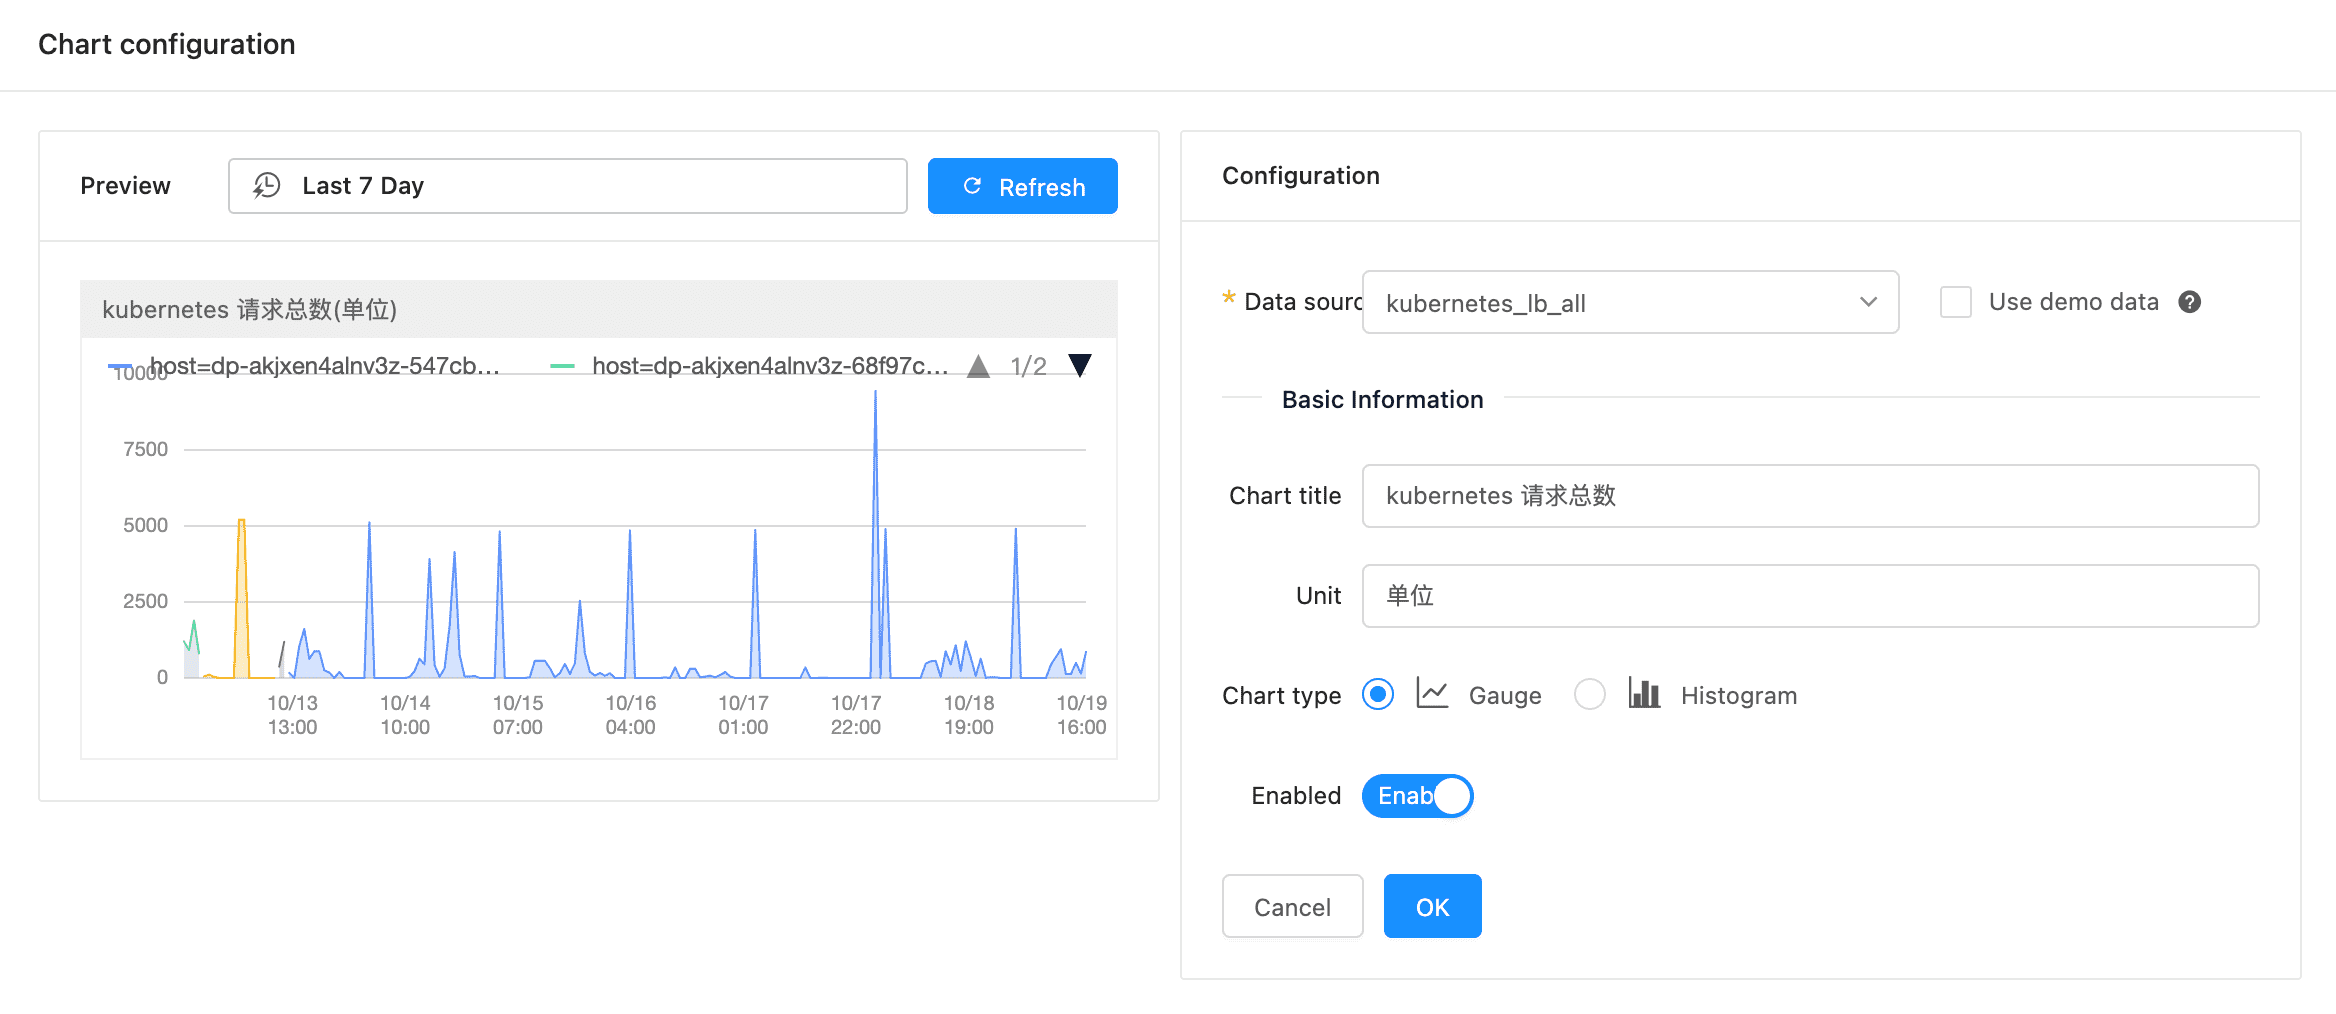
For the default image, you can change the default presentation.
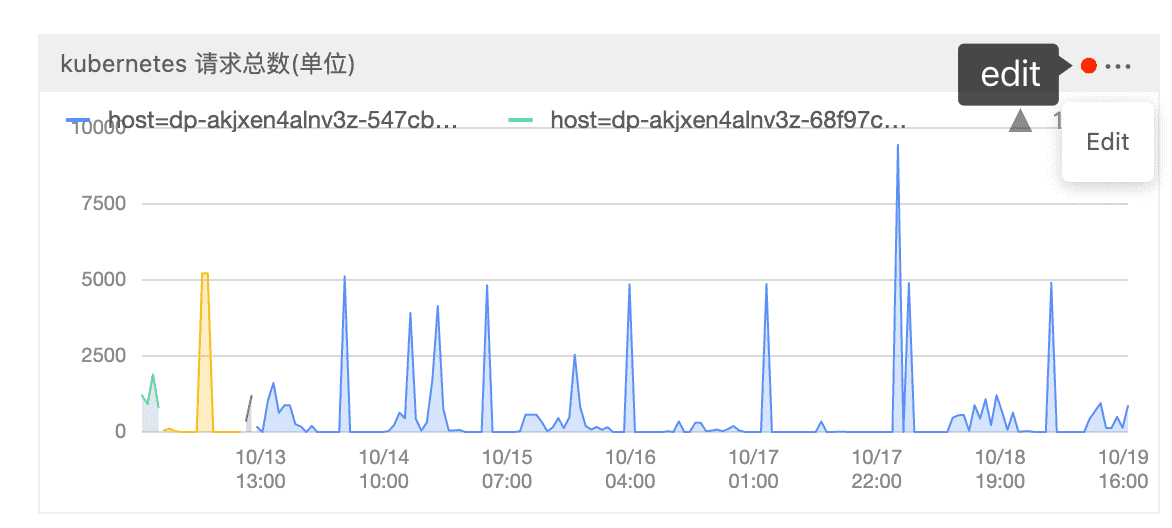
We can modify the data source, title, unit and chart type of the chart.