Logs #
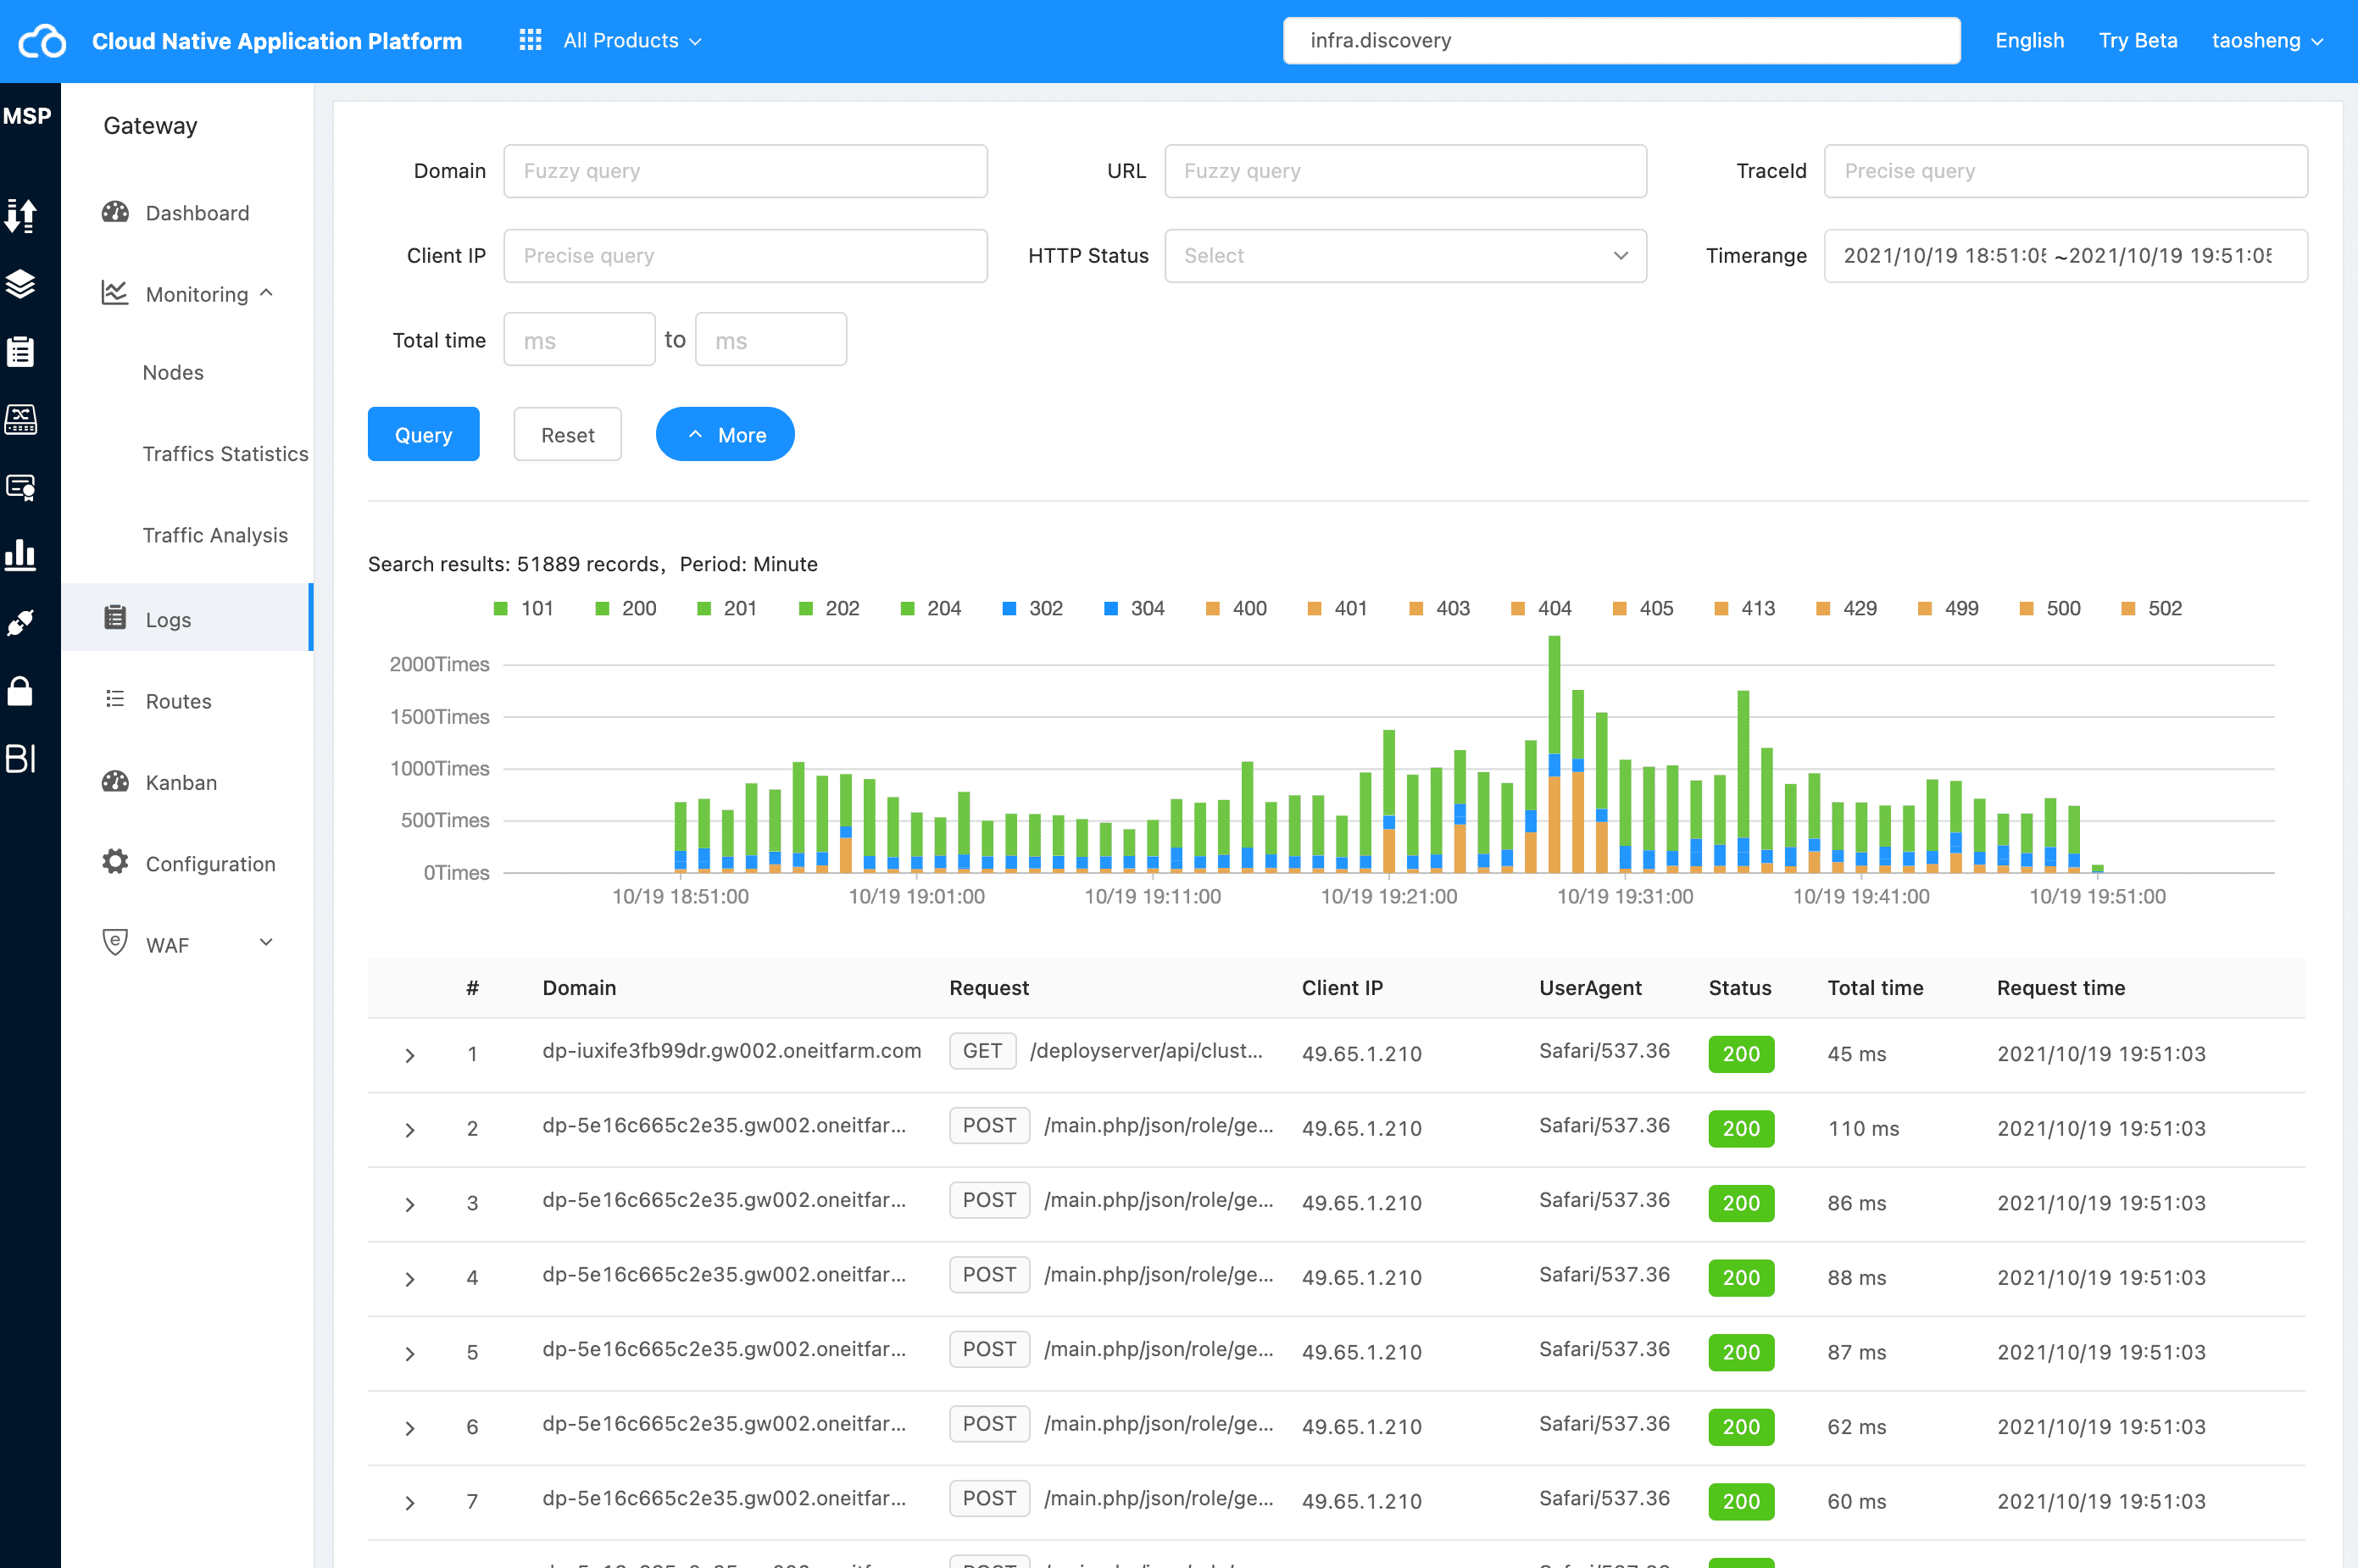
The gateway center log can view the details of each request passing through the gateway, as shown below:
Trend #
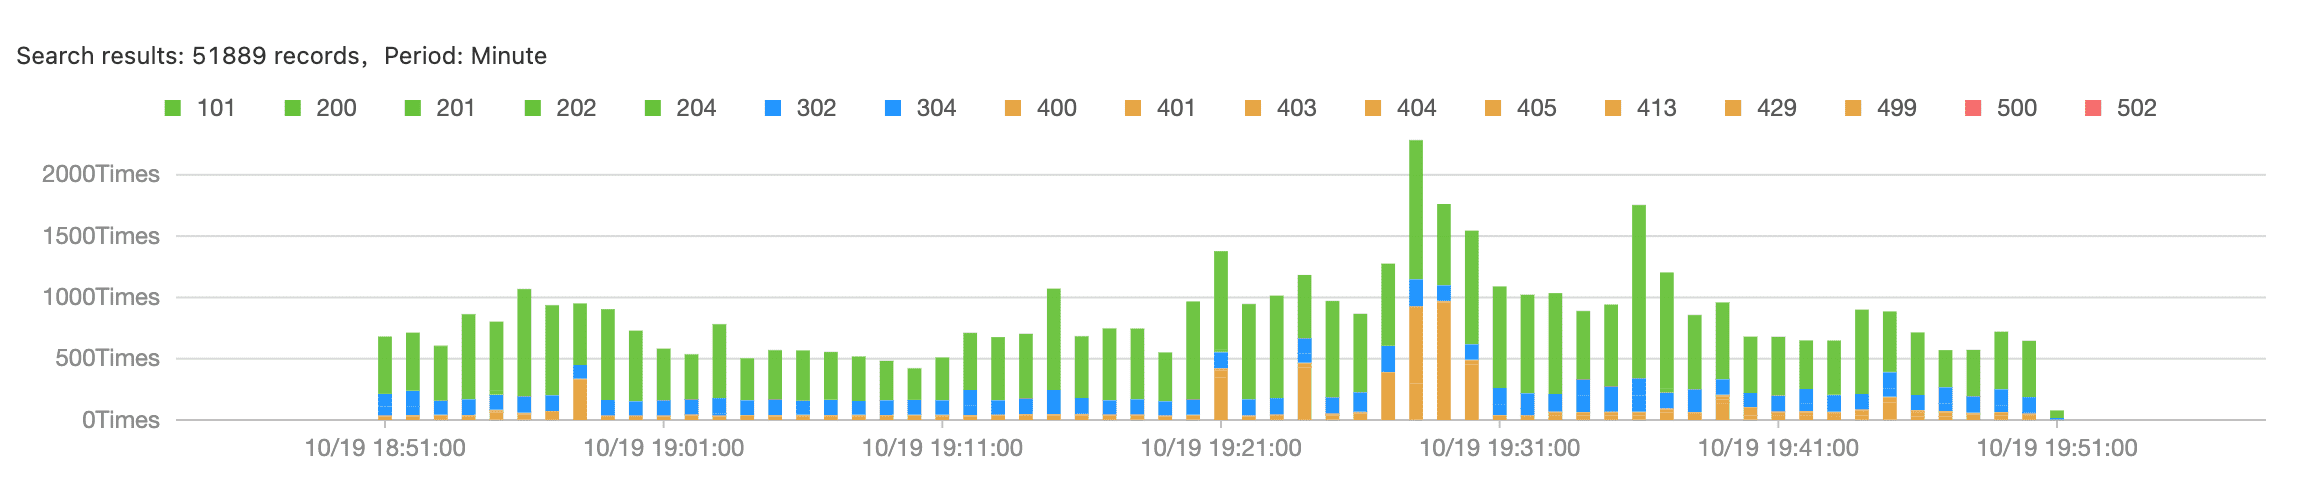
Through the chart, we list the distribution of gateway logs that meet the search criteria:
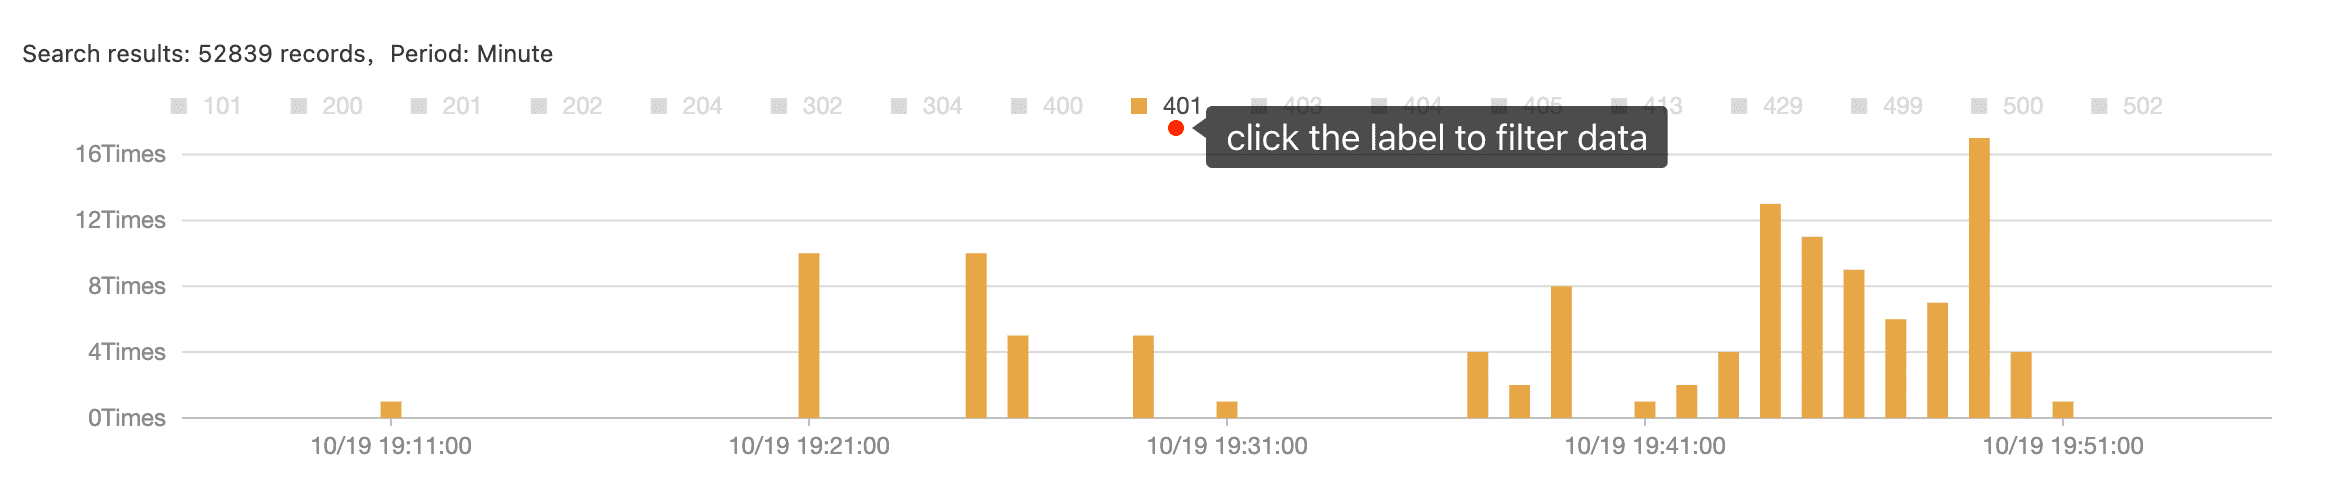
You can filter by clicking the specific status code label
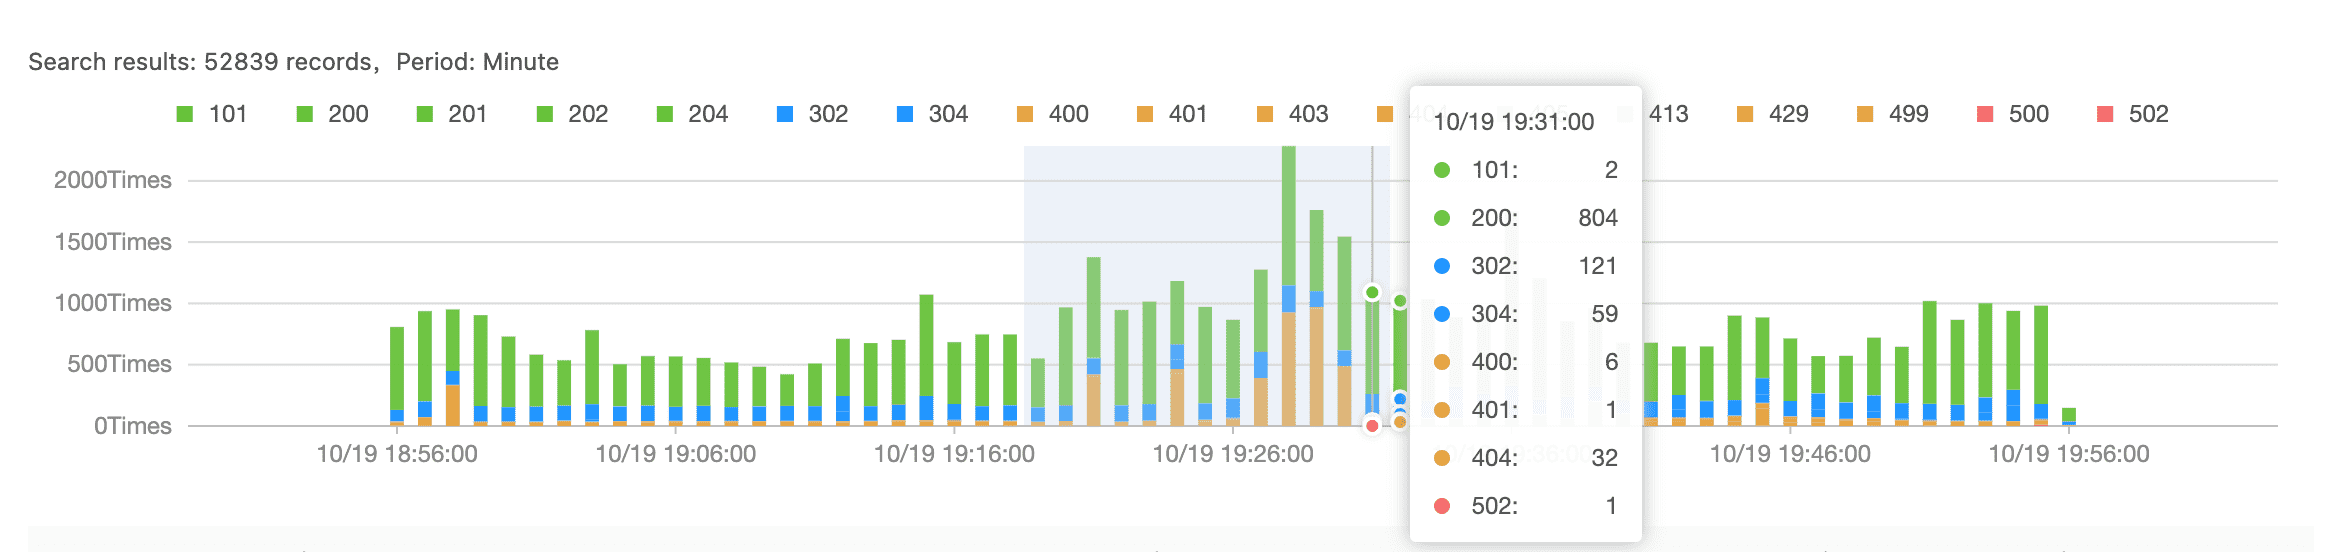
We can also “slide” a time range to apply the time range as search criteria:
Detail #
After determining the search criteria, we can view the gateway log in the form of “table”. If we need to view more information of a record, we can click the “arrow” in front of the table.
At present, two perspectives are supported to view details:
- Table
- JSON
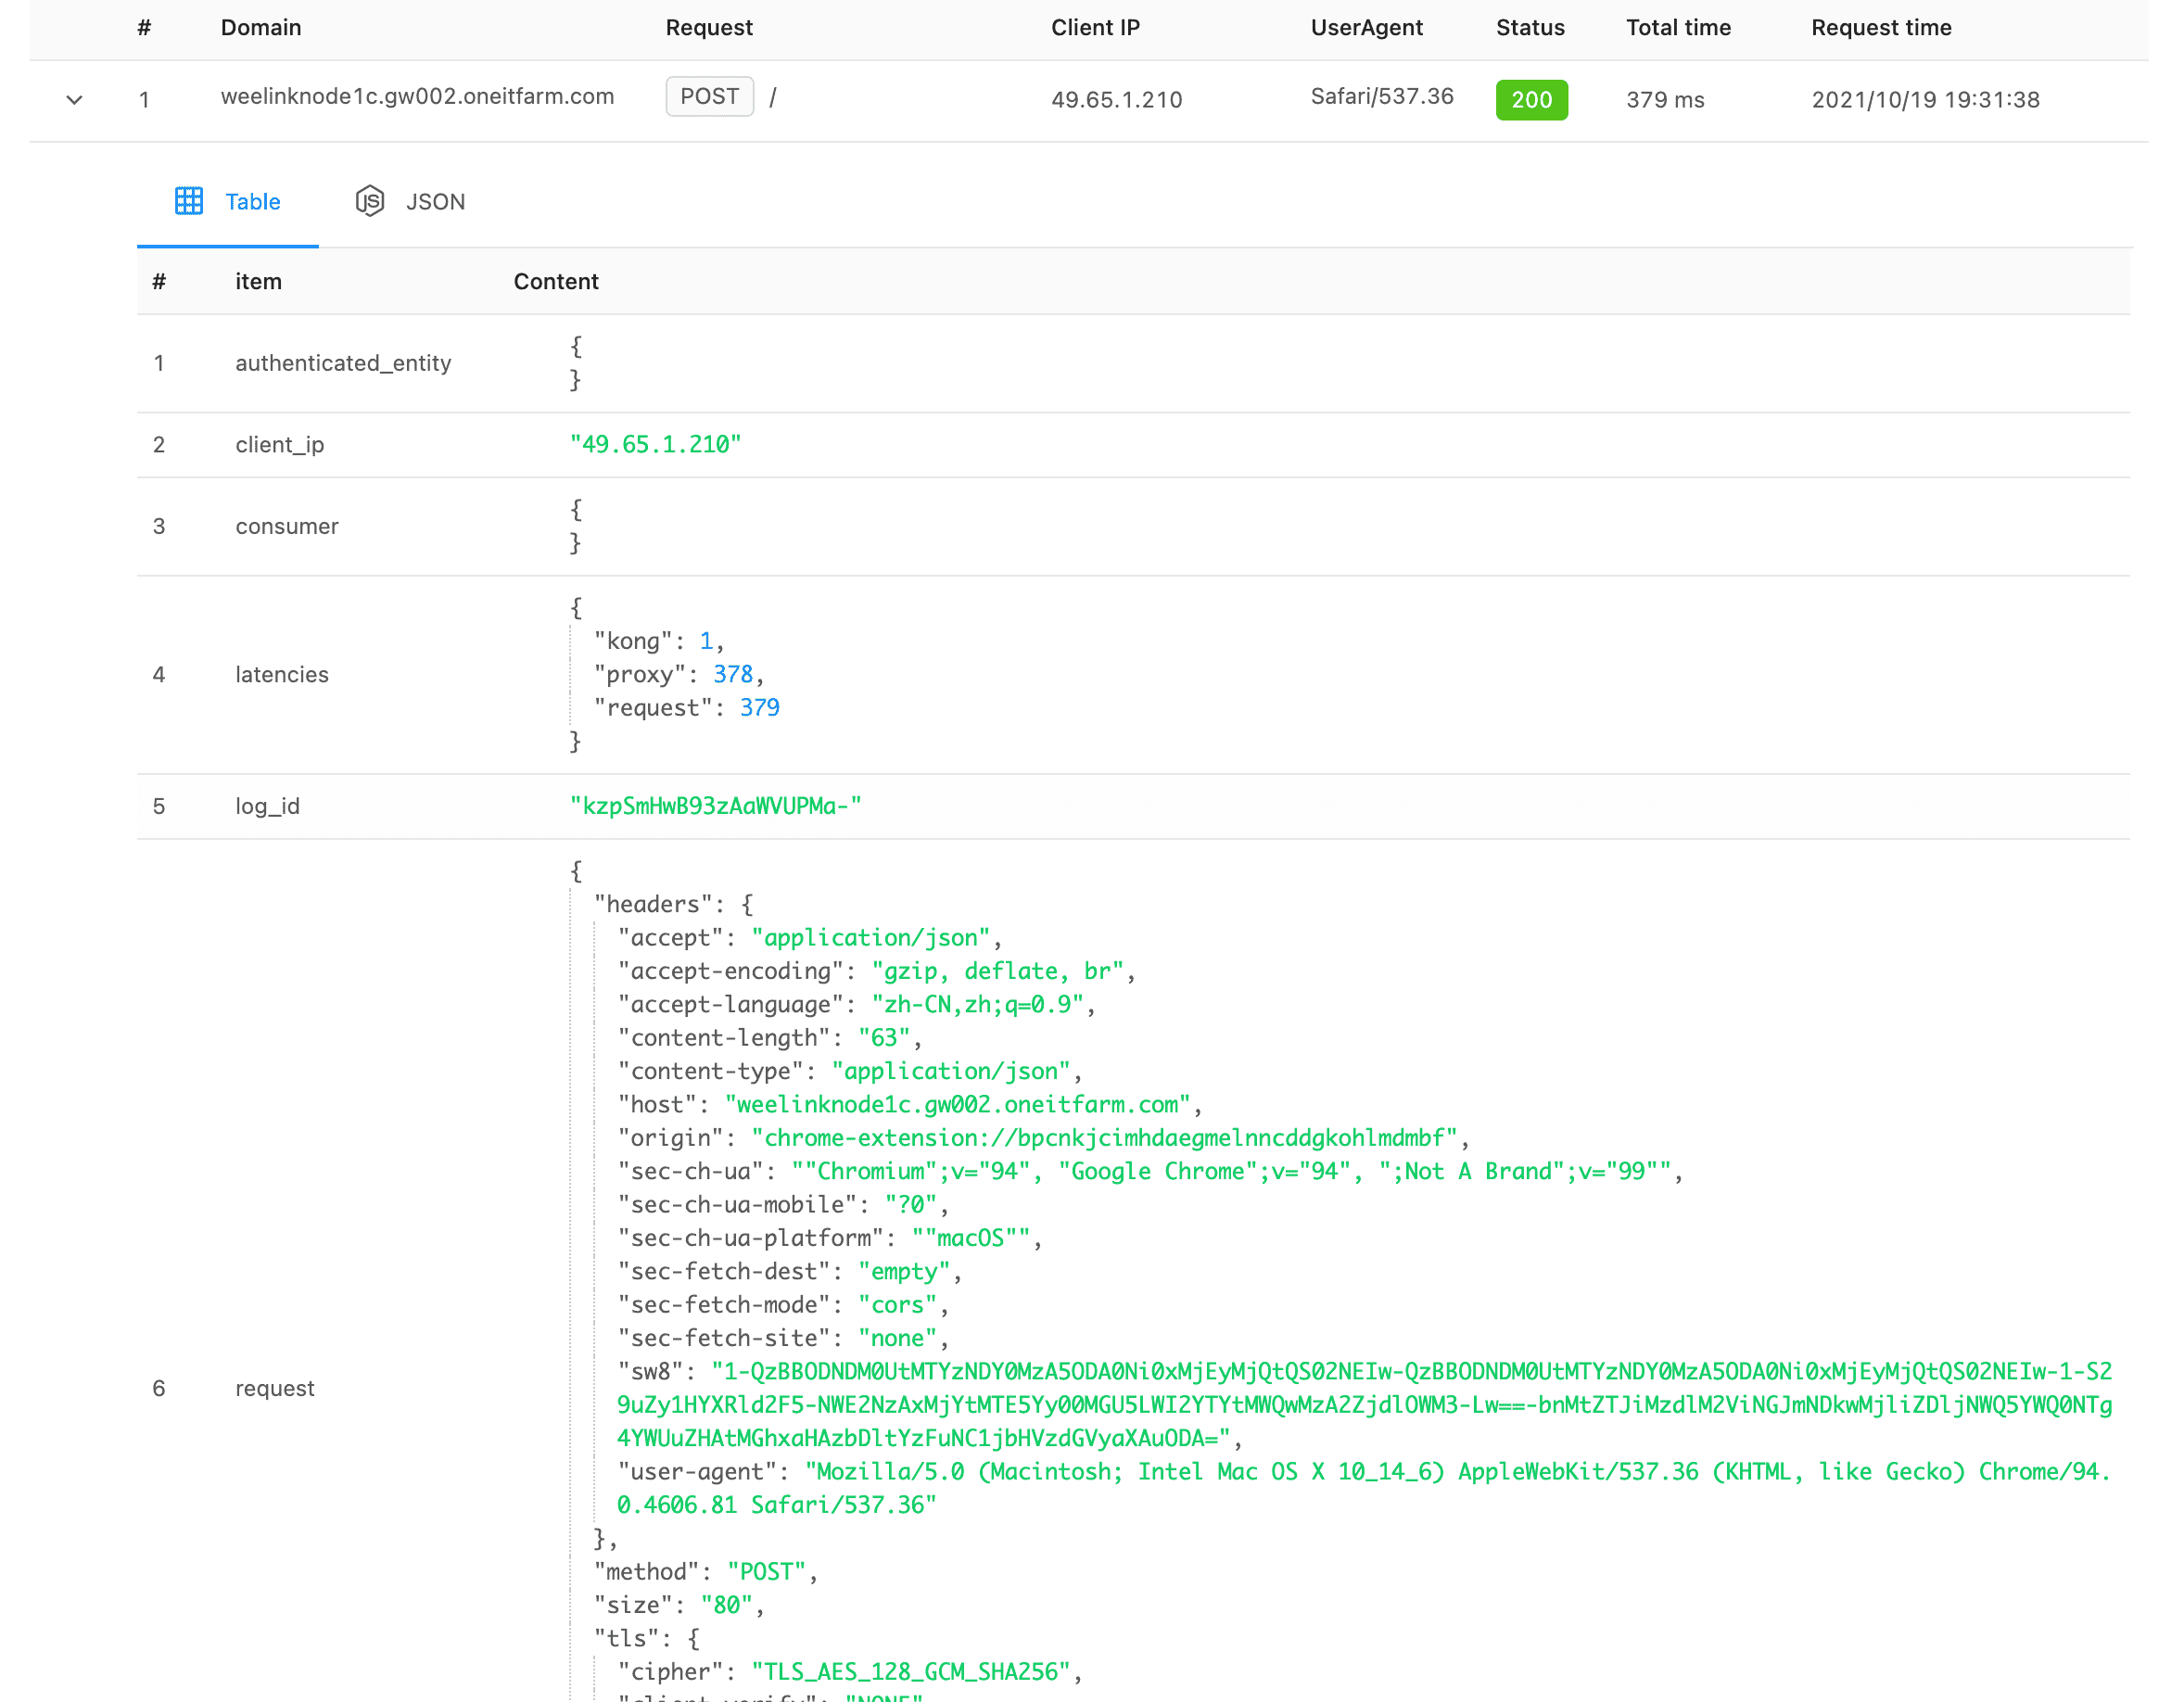
Table view
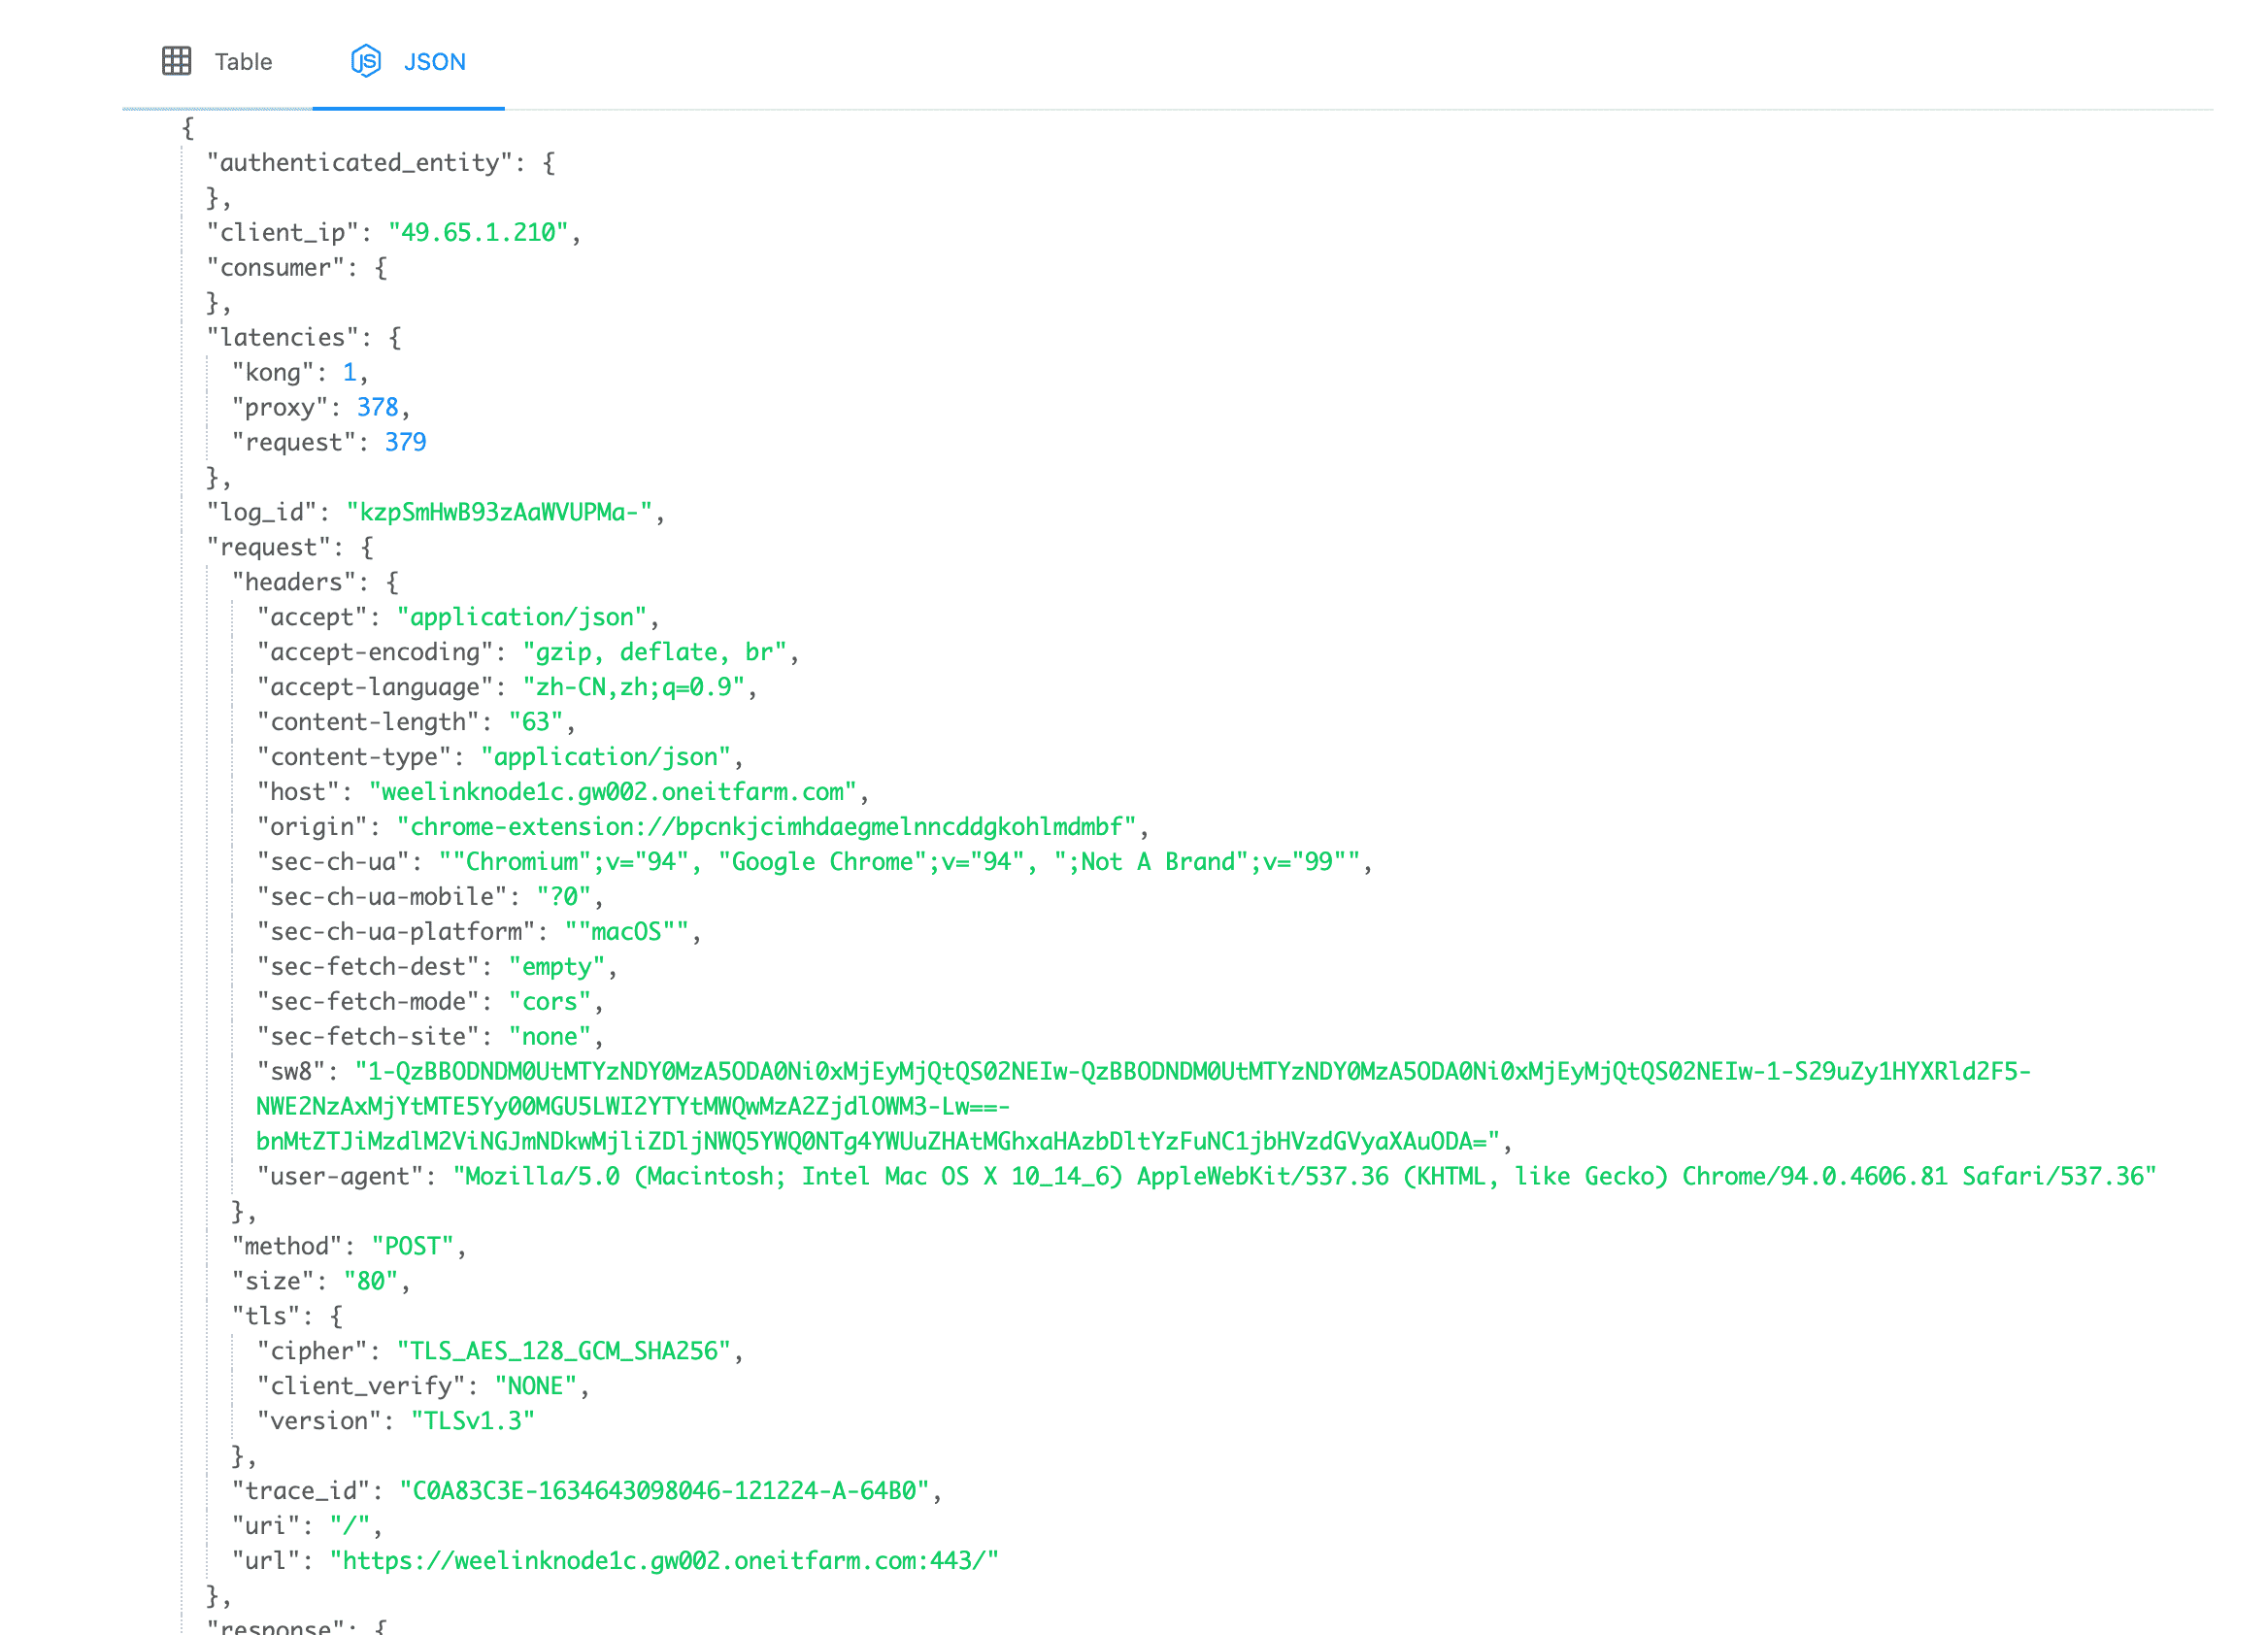
JSON view