Kanban #
Through service traffic monitoring, we can see three levels of gateway data, from large to small:
- Platform level gateway data
- Service level gateway data
- API level gateway data
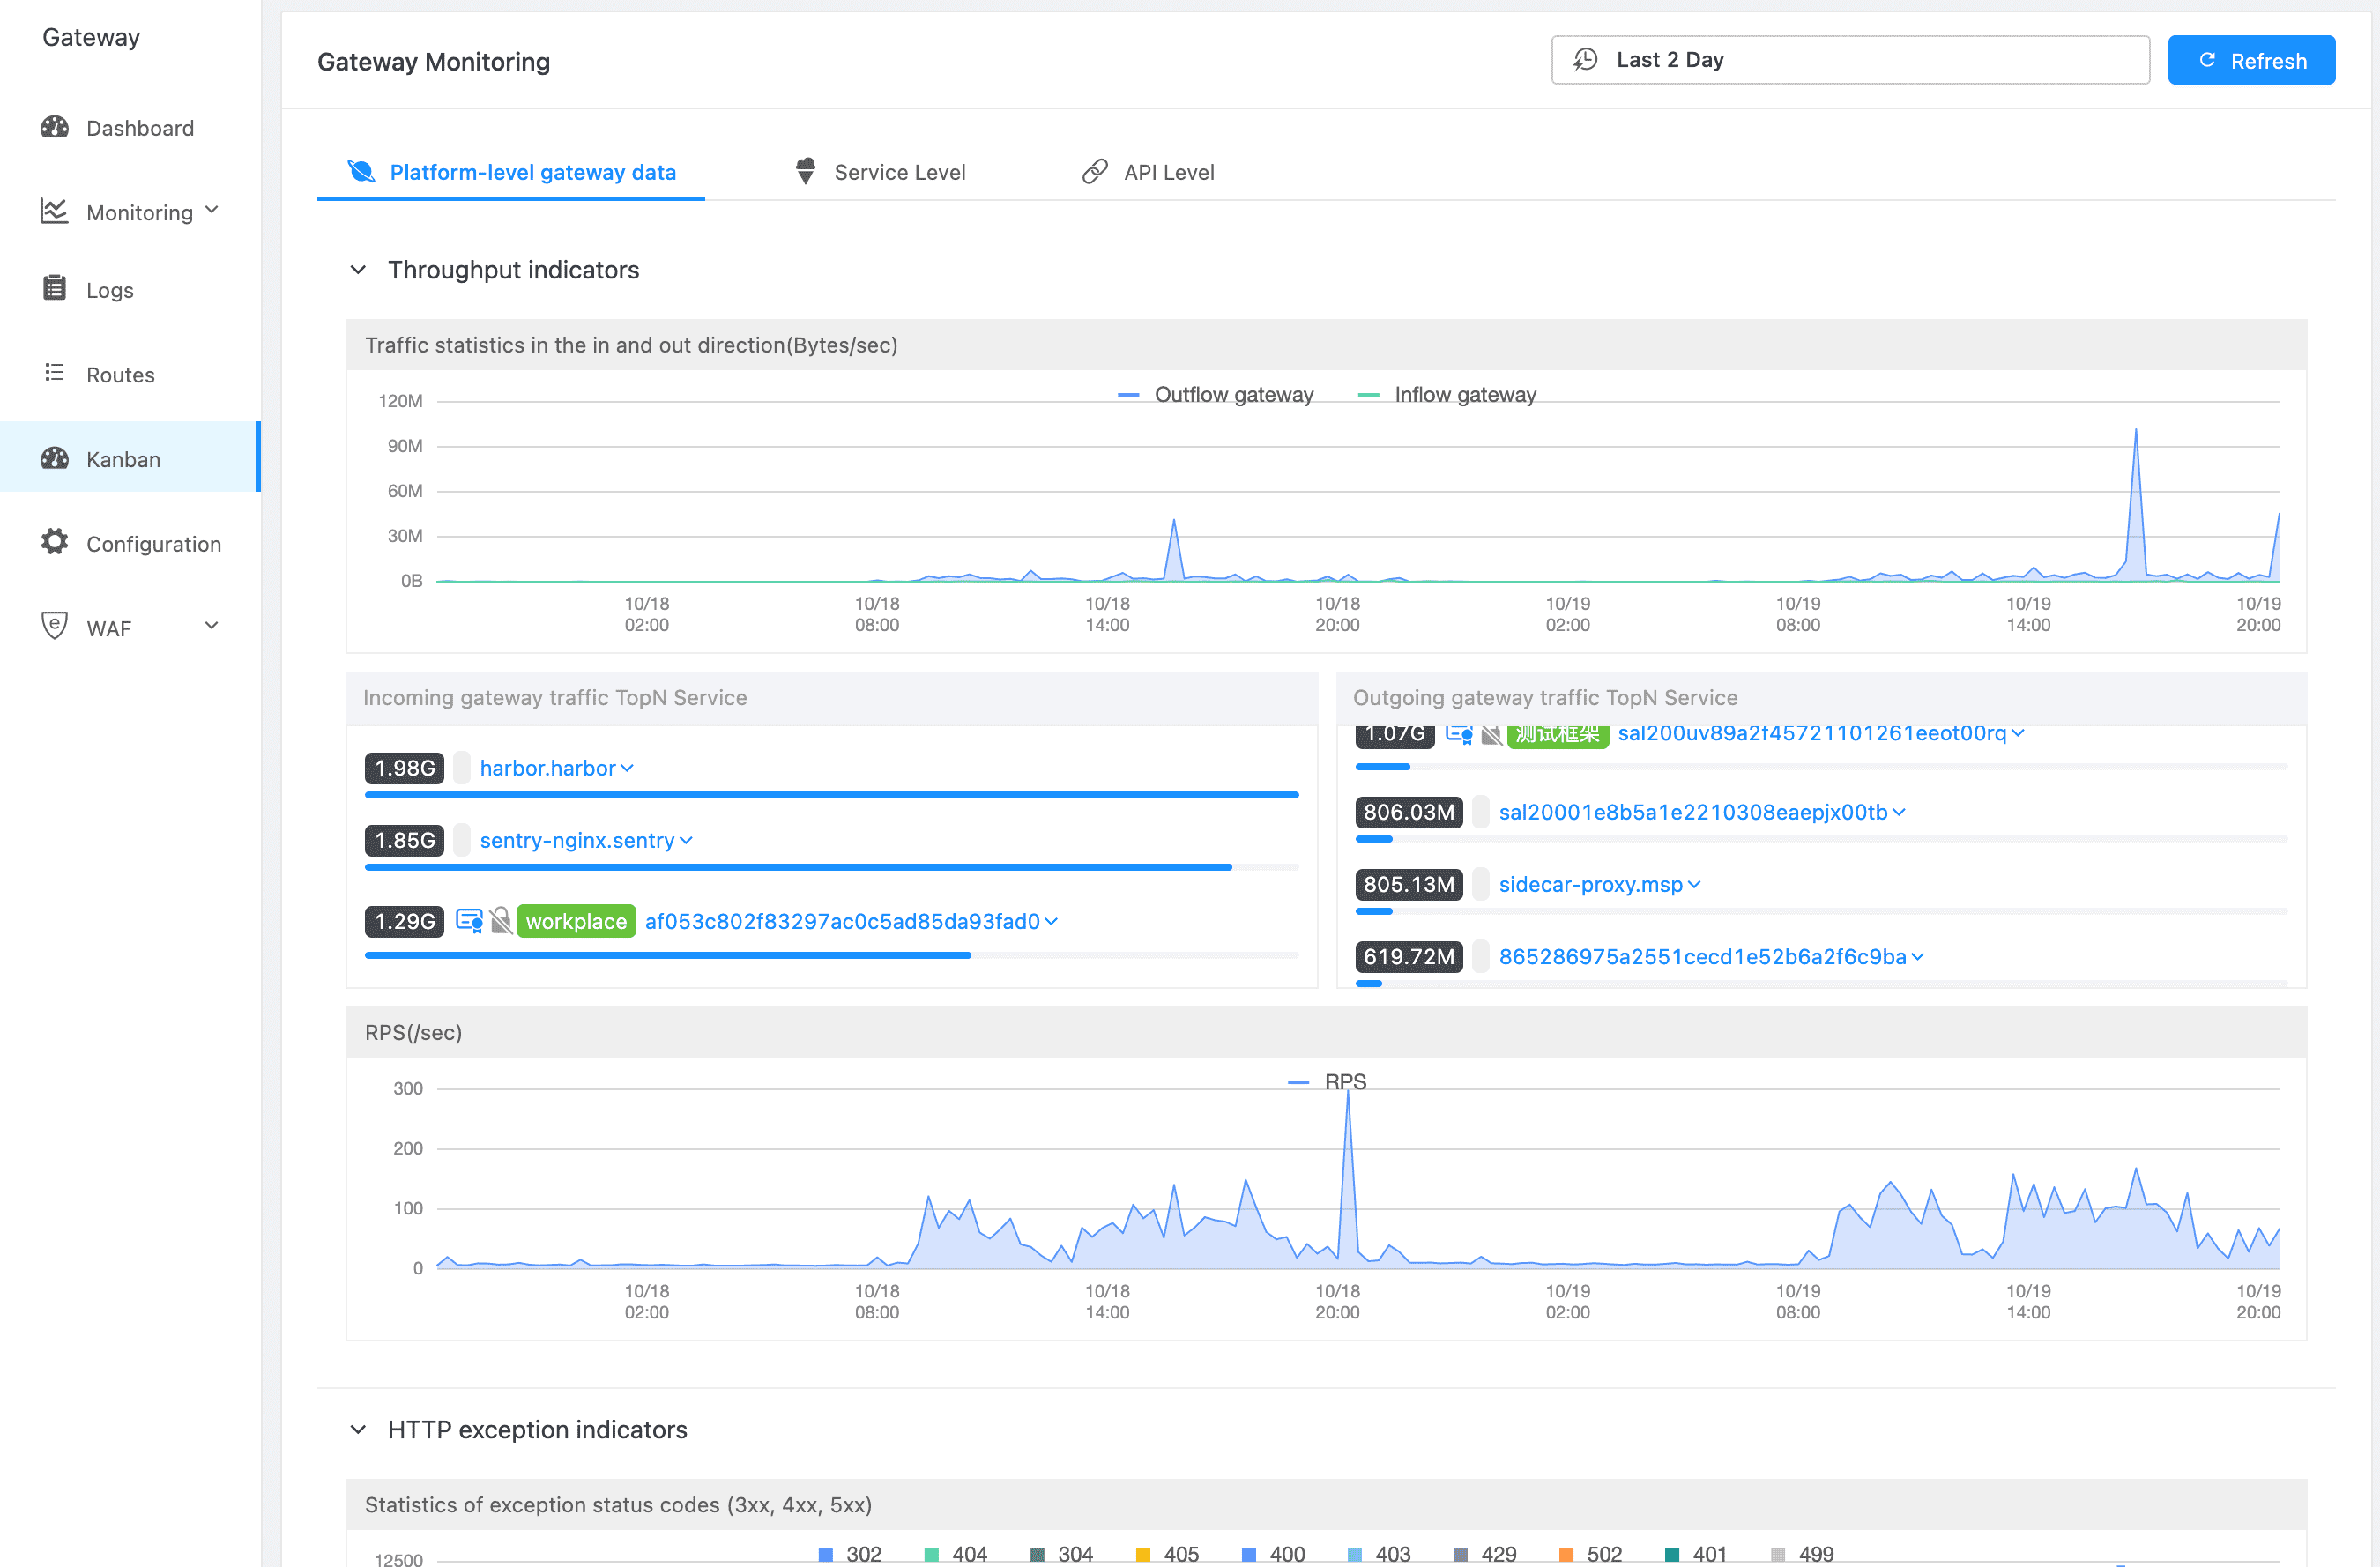
By switching the tab, we can view gateway monitoring data from different perspectives.
Platform Level #
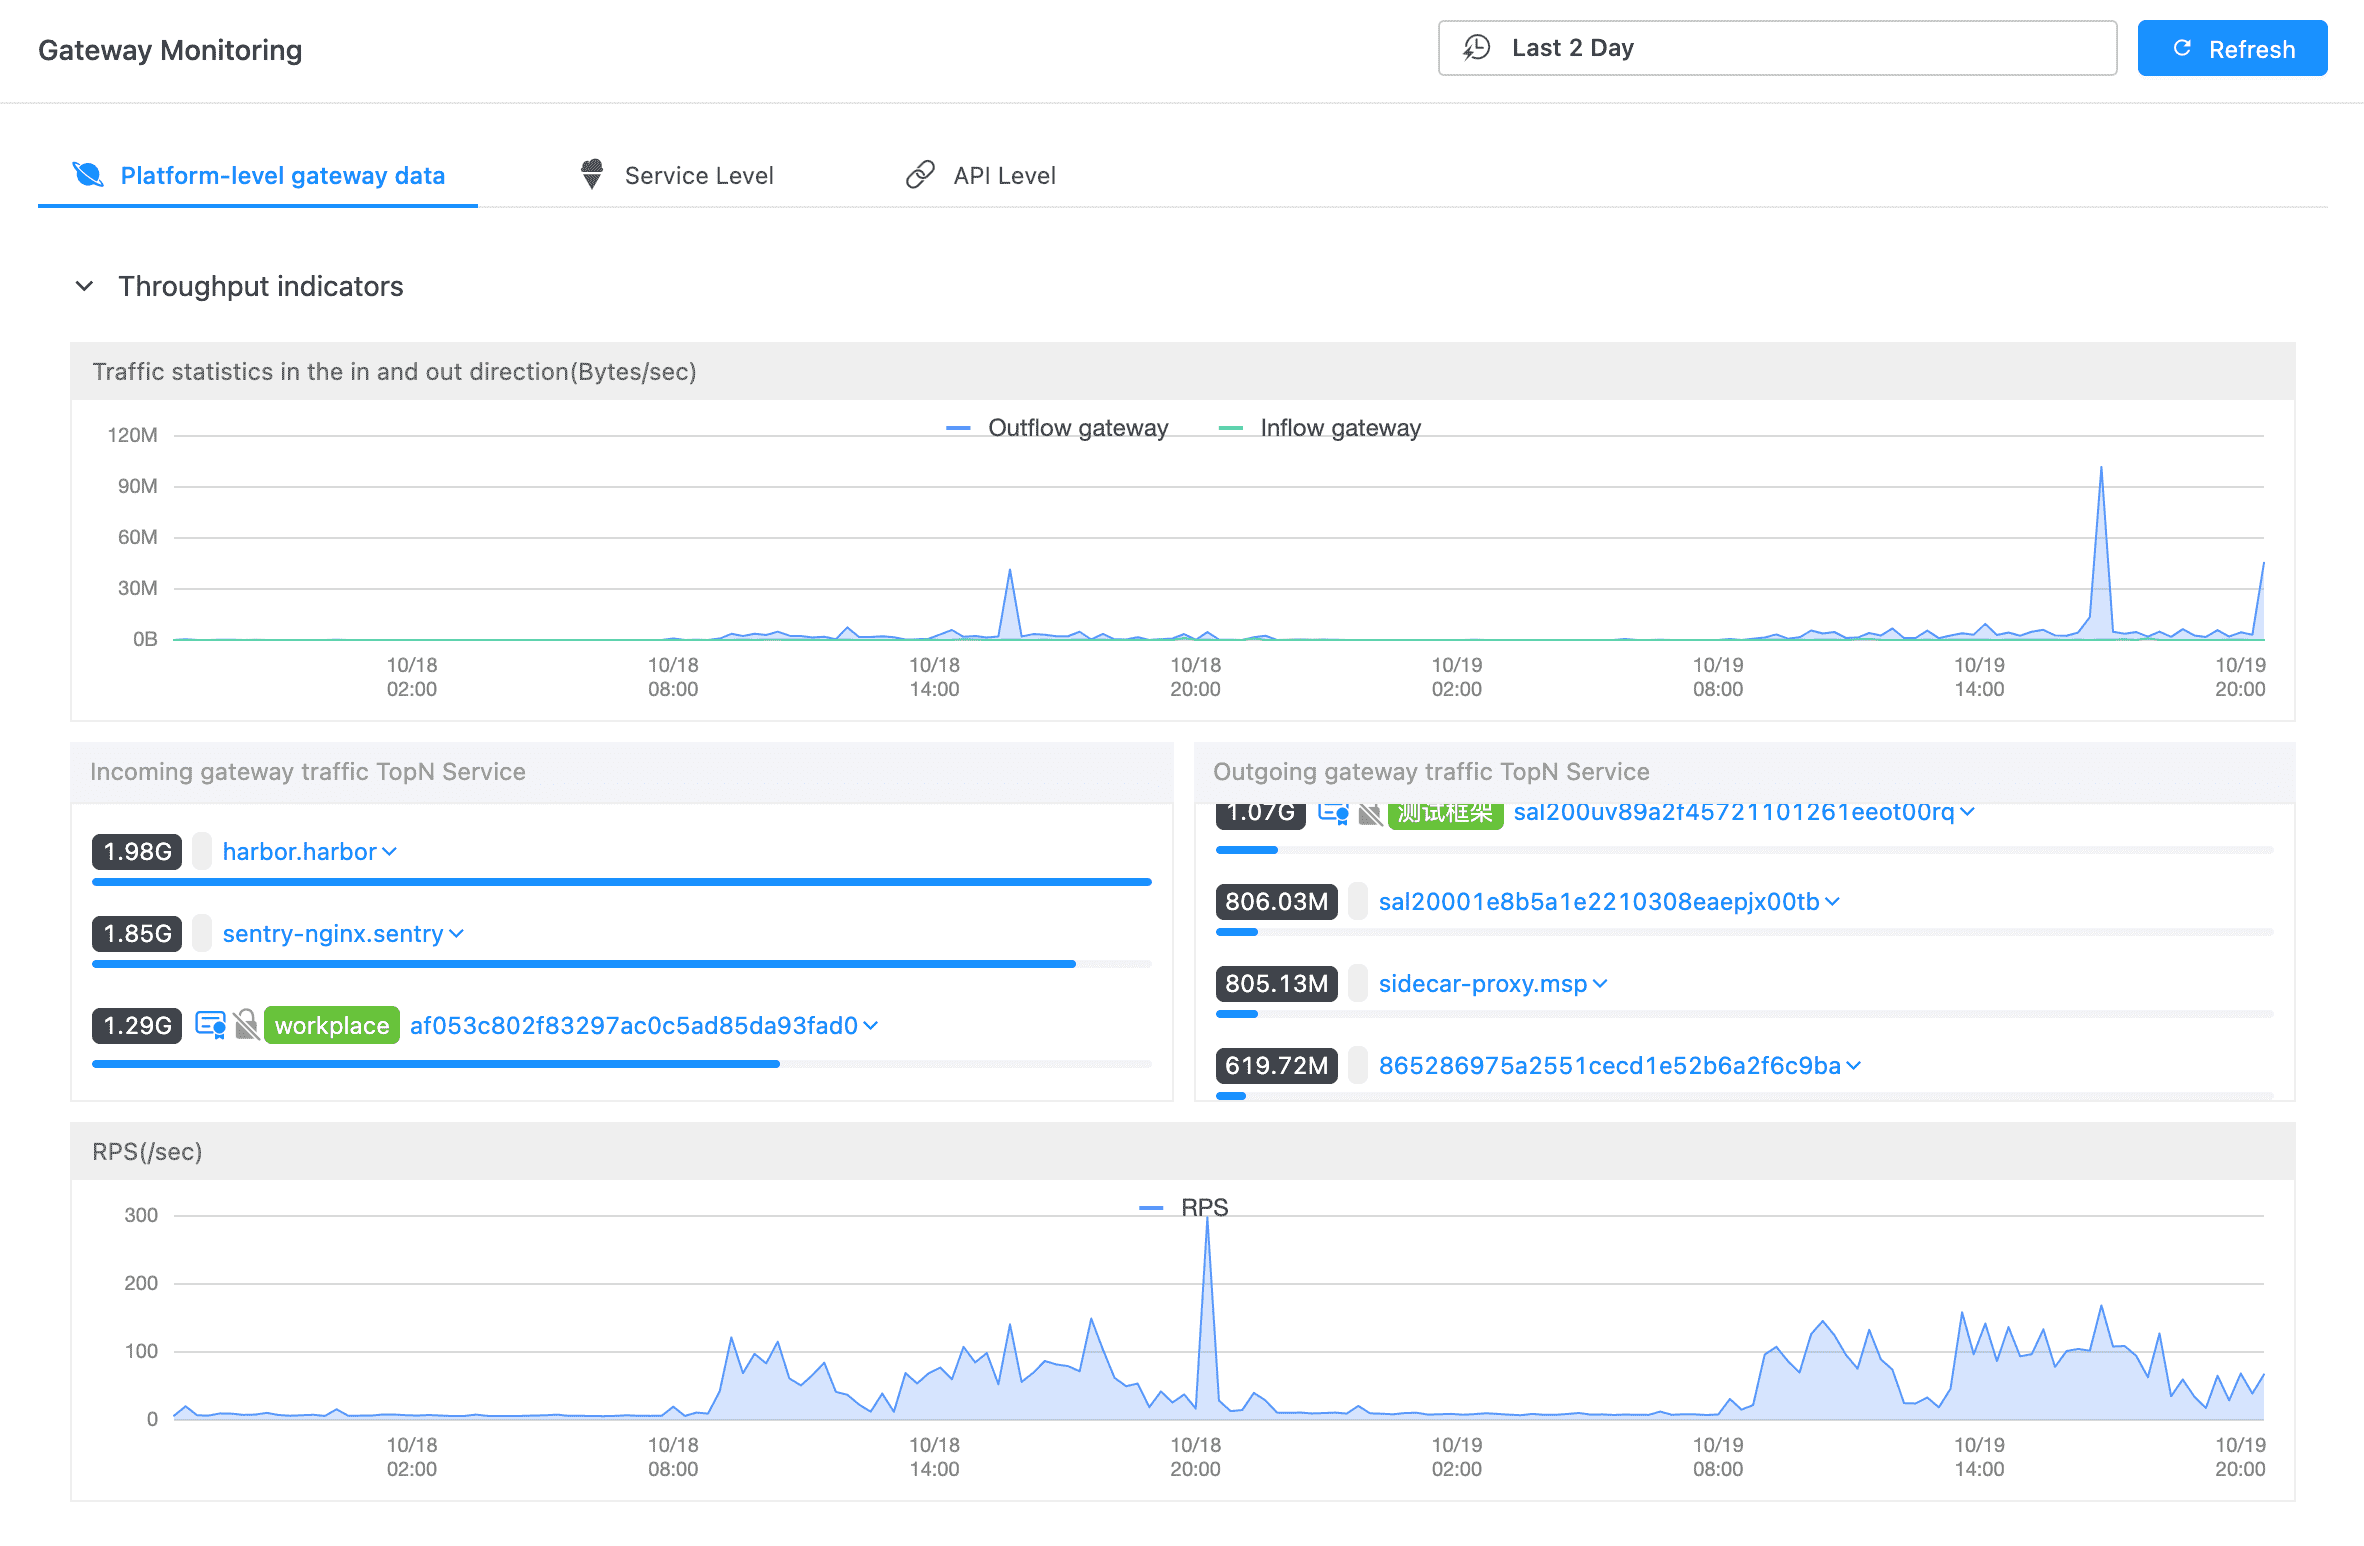
Throughput #
- Traffic statistics in the in and out direction
- Incoming and outgoing gateway traffic TopN Service
- RPS
HTTP Exception #
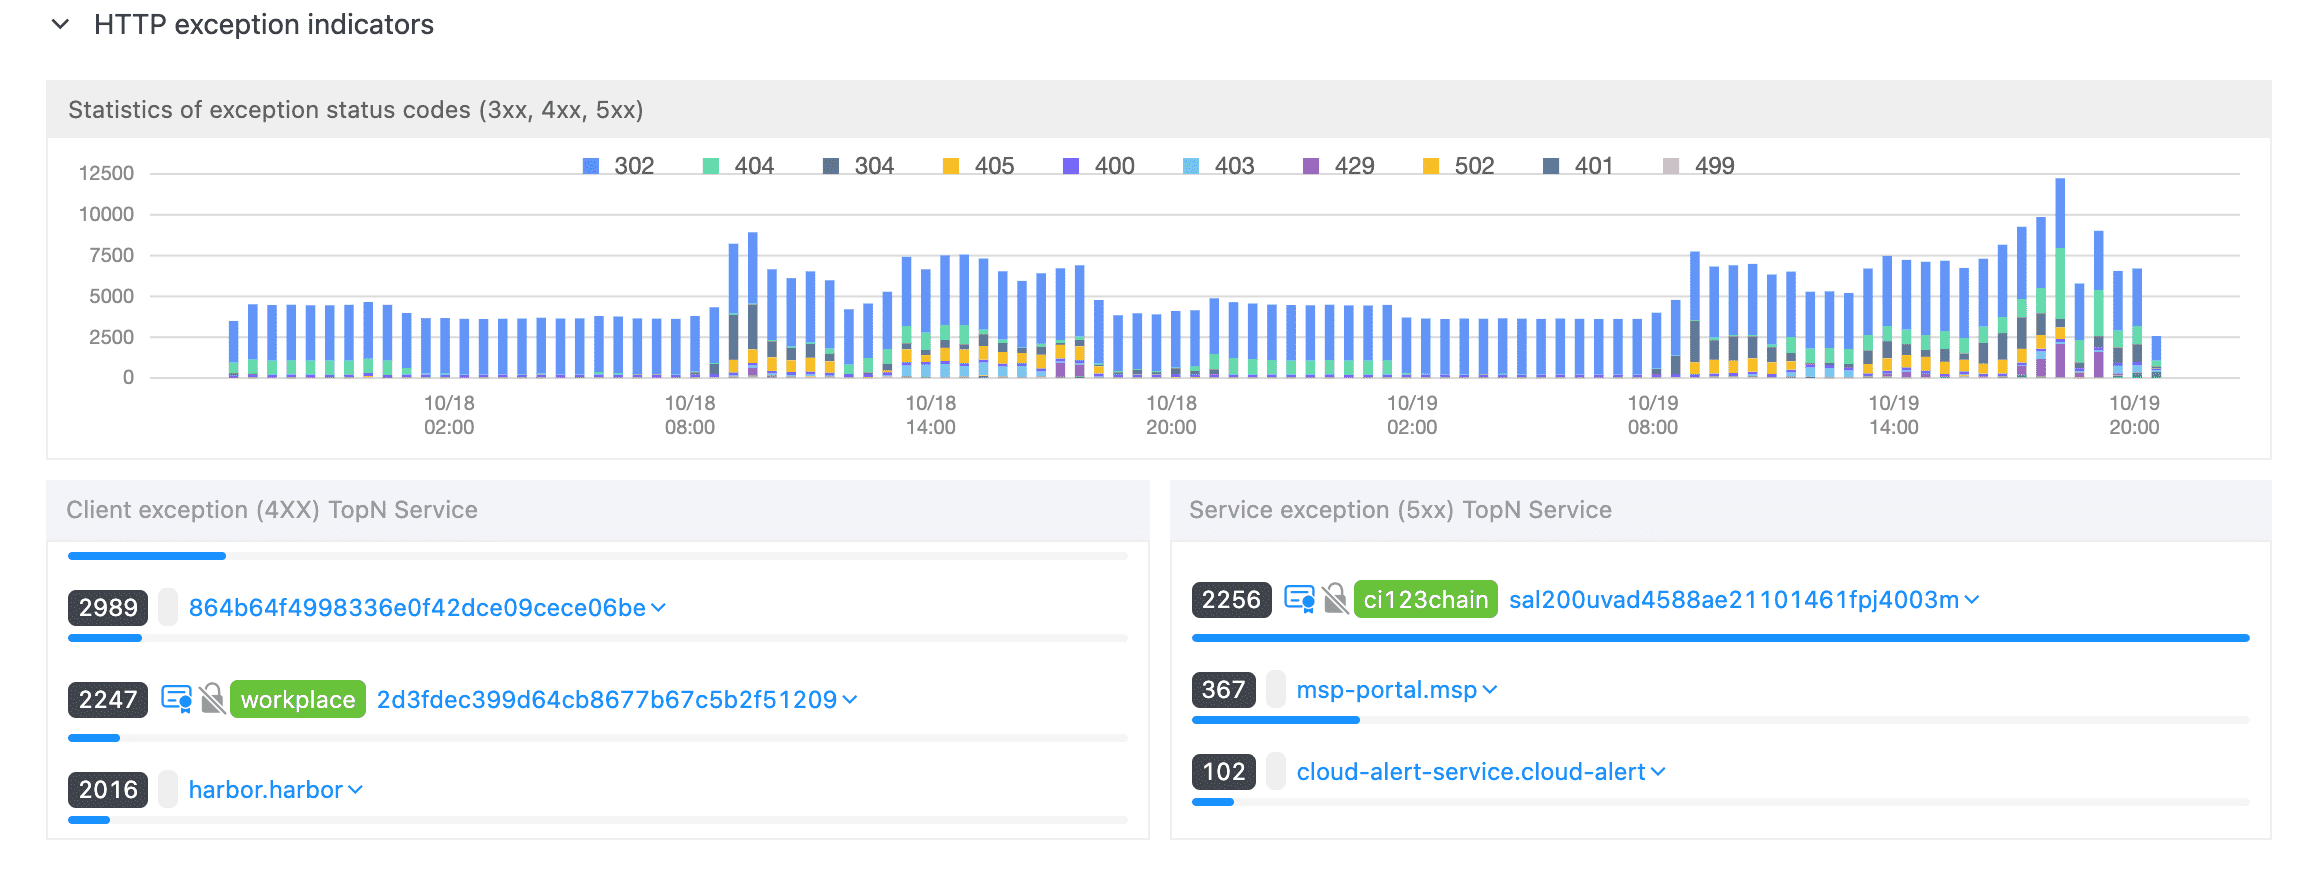
You can view the overall distribution of exception status codes (3xx, 4xx, 5xx) of requests passing through the gateway. At the same time, we can also view the ranking of exception services to facilitate users to further locate high-frequency exception services.
Latency #
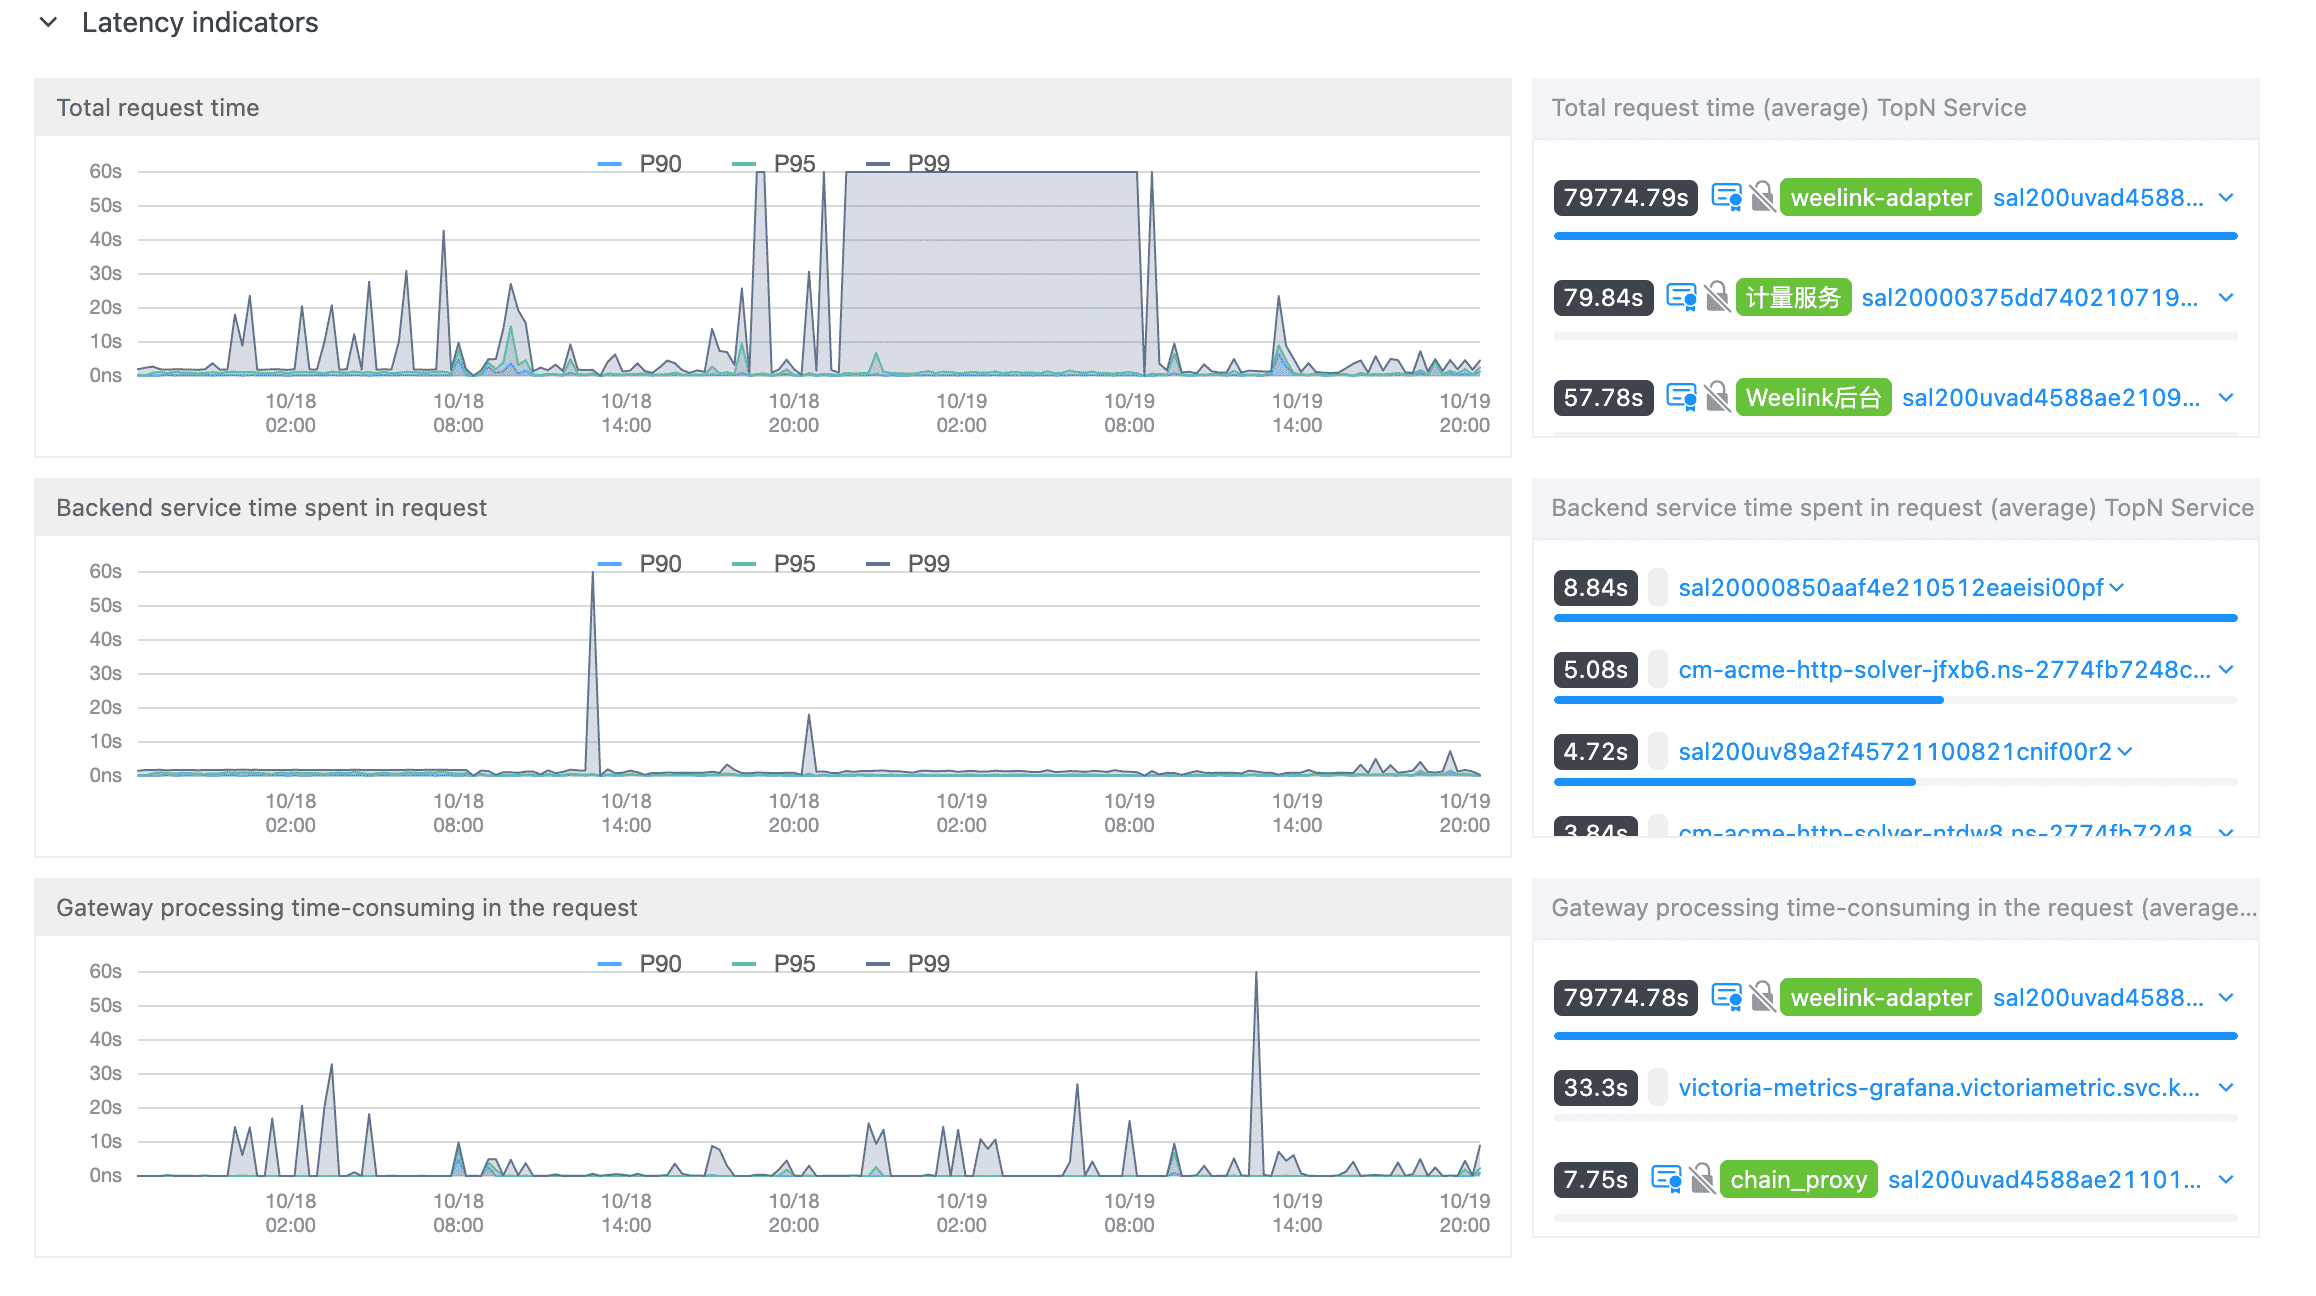
The delay indicator shows the total time-consuming of the request, the time-consuming of back-end services, and the time-consuming of gateway processing. At the same time, the ranking of high delay services is listed to facilitate users to locate high delay services.
Service Level #
From the platform perspective, we can locate the bottleneck service. From the service perspective, we can observe all API information under the service.
Throughput #
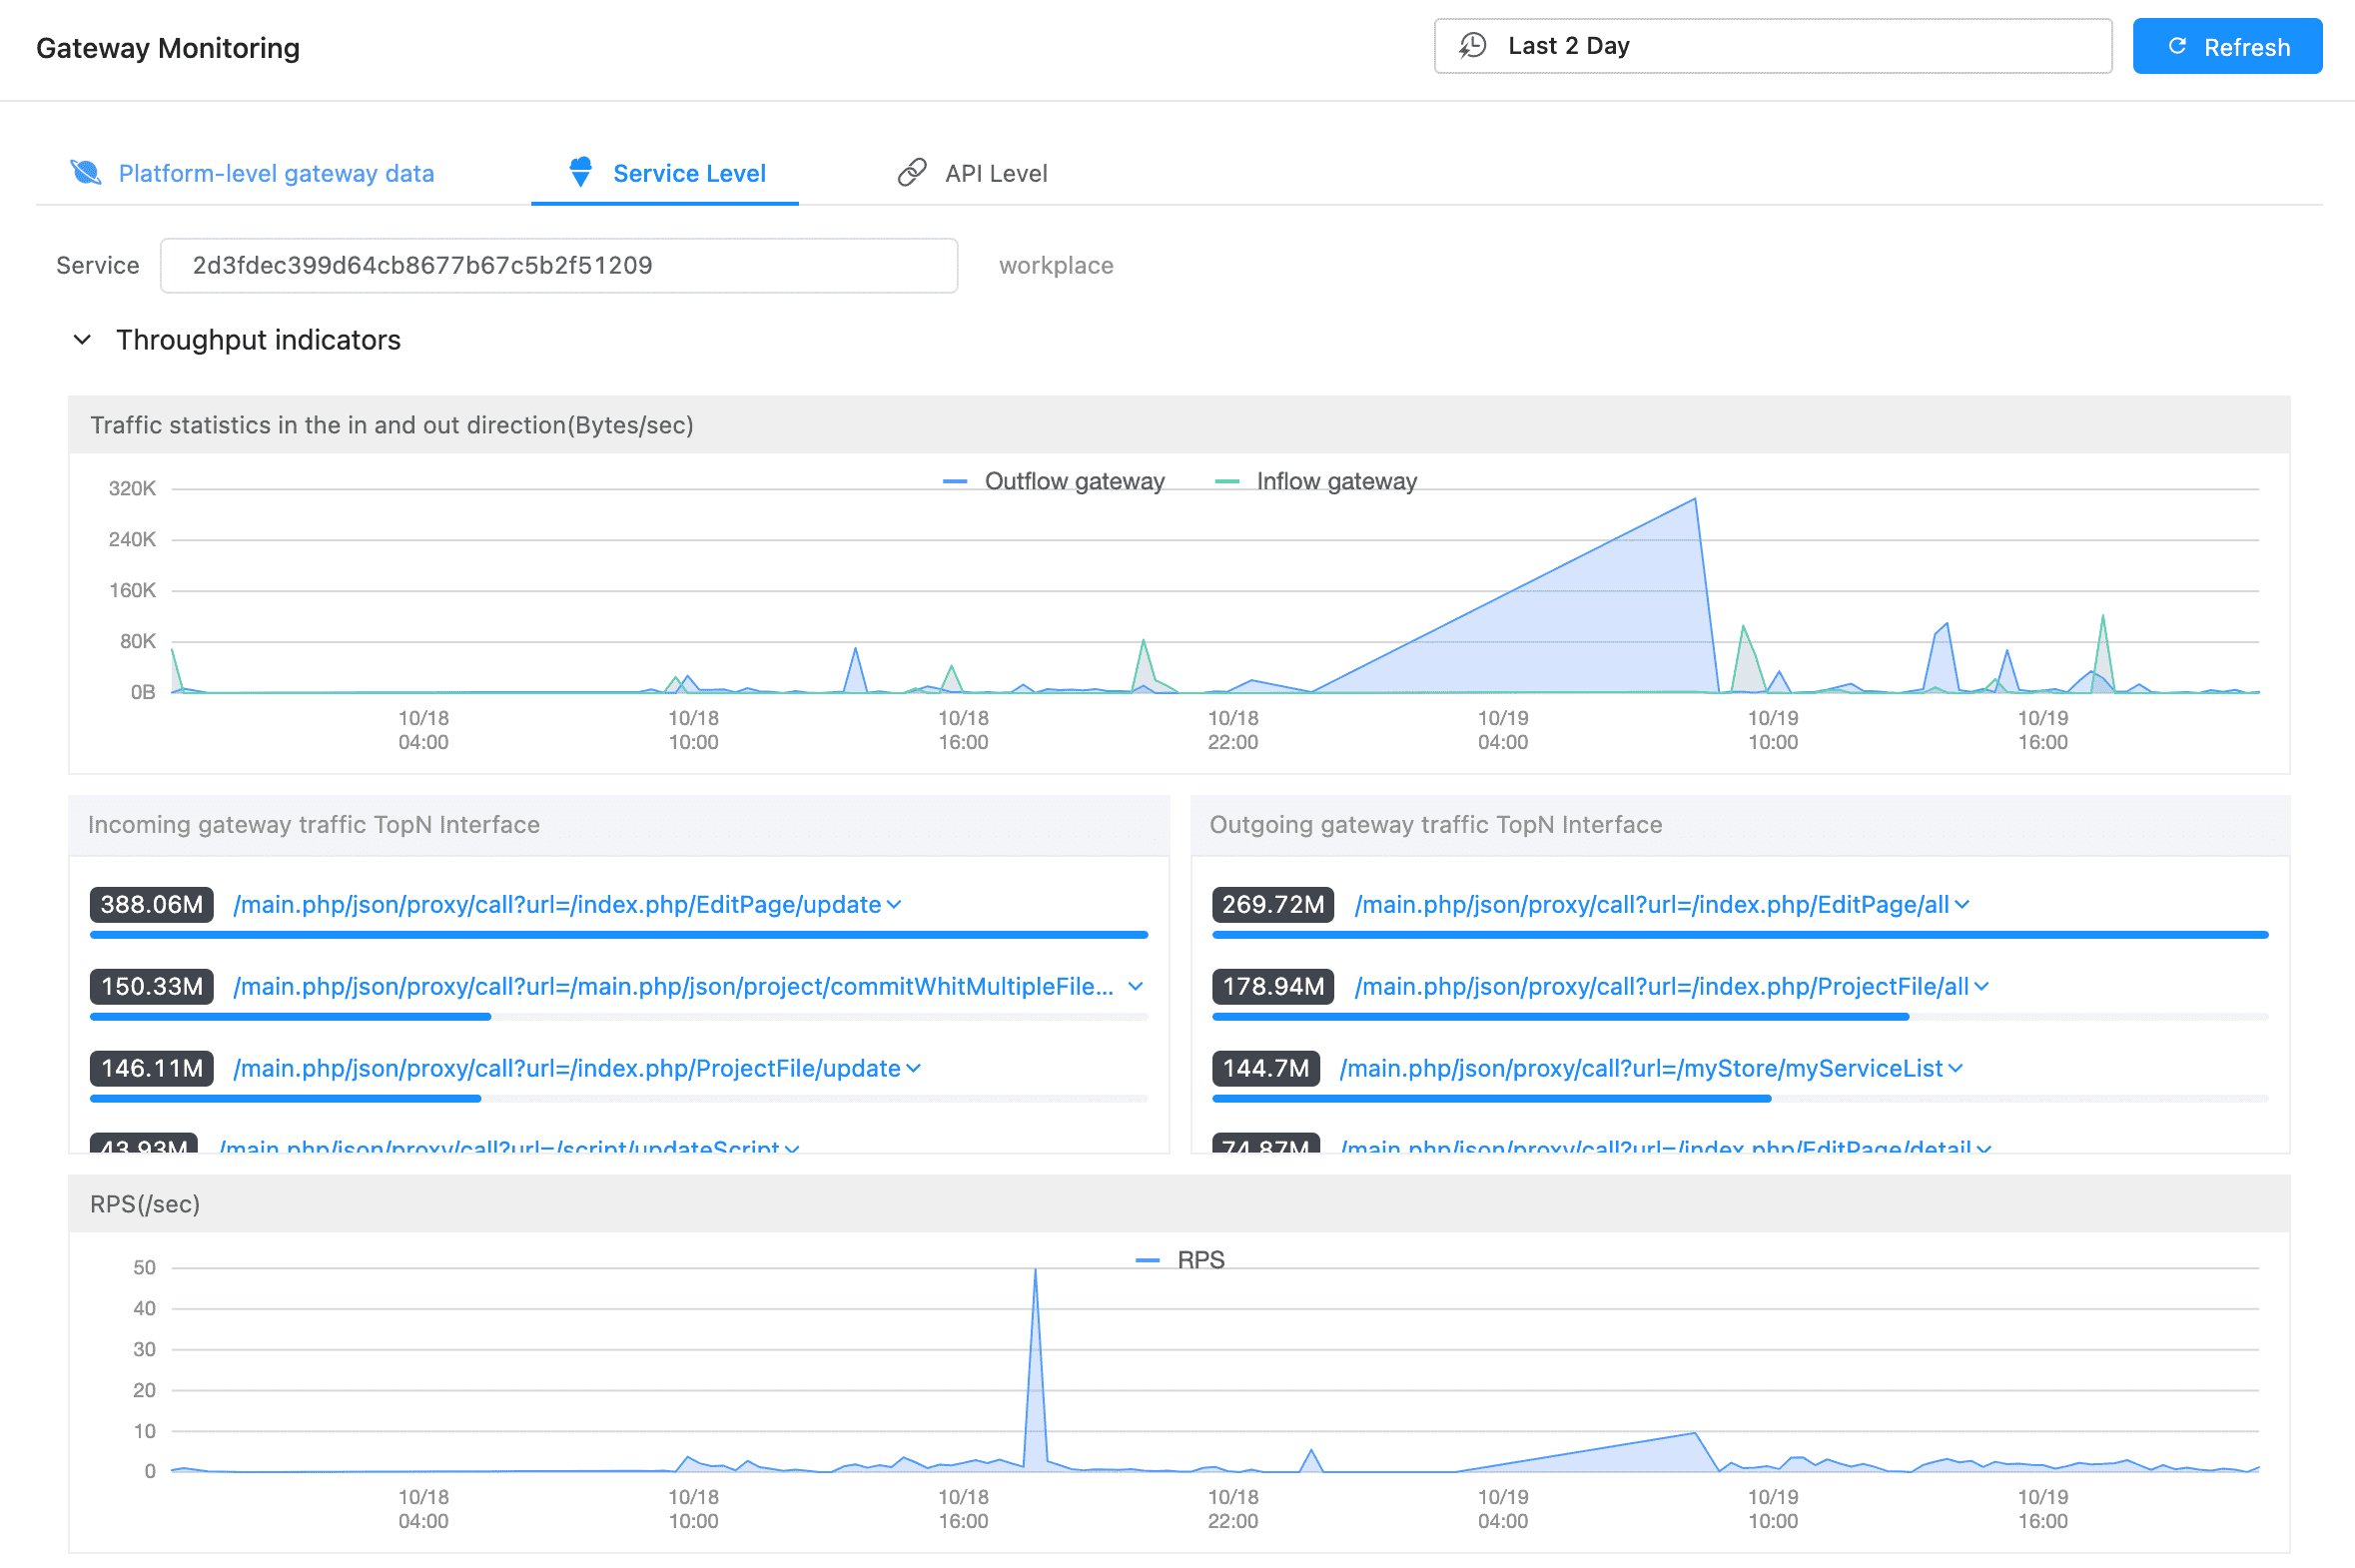
Compared with the throughput indicators of “platform perspective”, the traffic statistics of the service can be observed here, and the high traffic API will be sorted.
HTTP Exception #
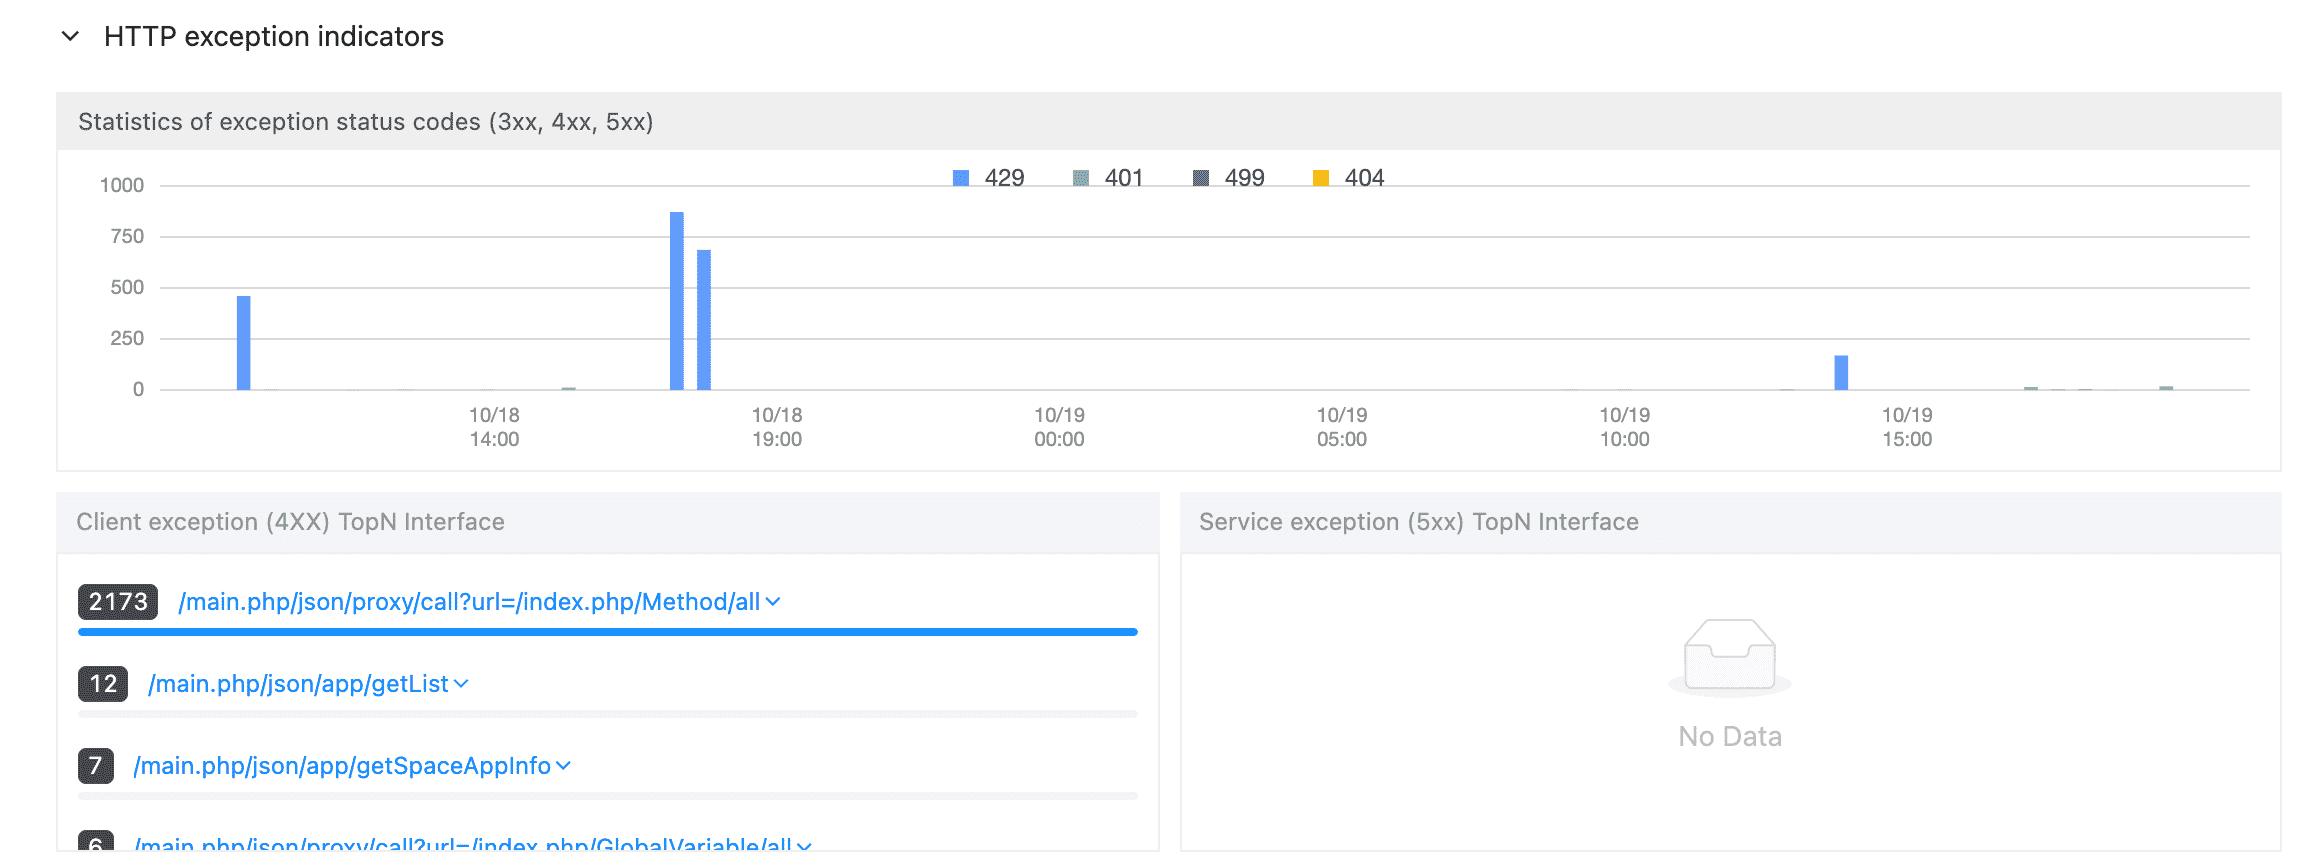
Compared with the HTTP exception indicator of “platform perspective”, the HTTP exception status code statistics of the service can be observed here, and the high-frequency exception API will be sorted.
Latency #
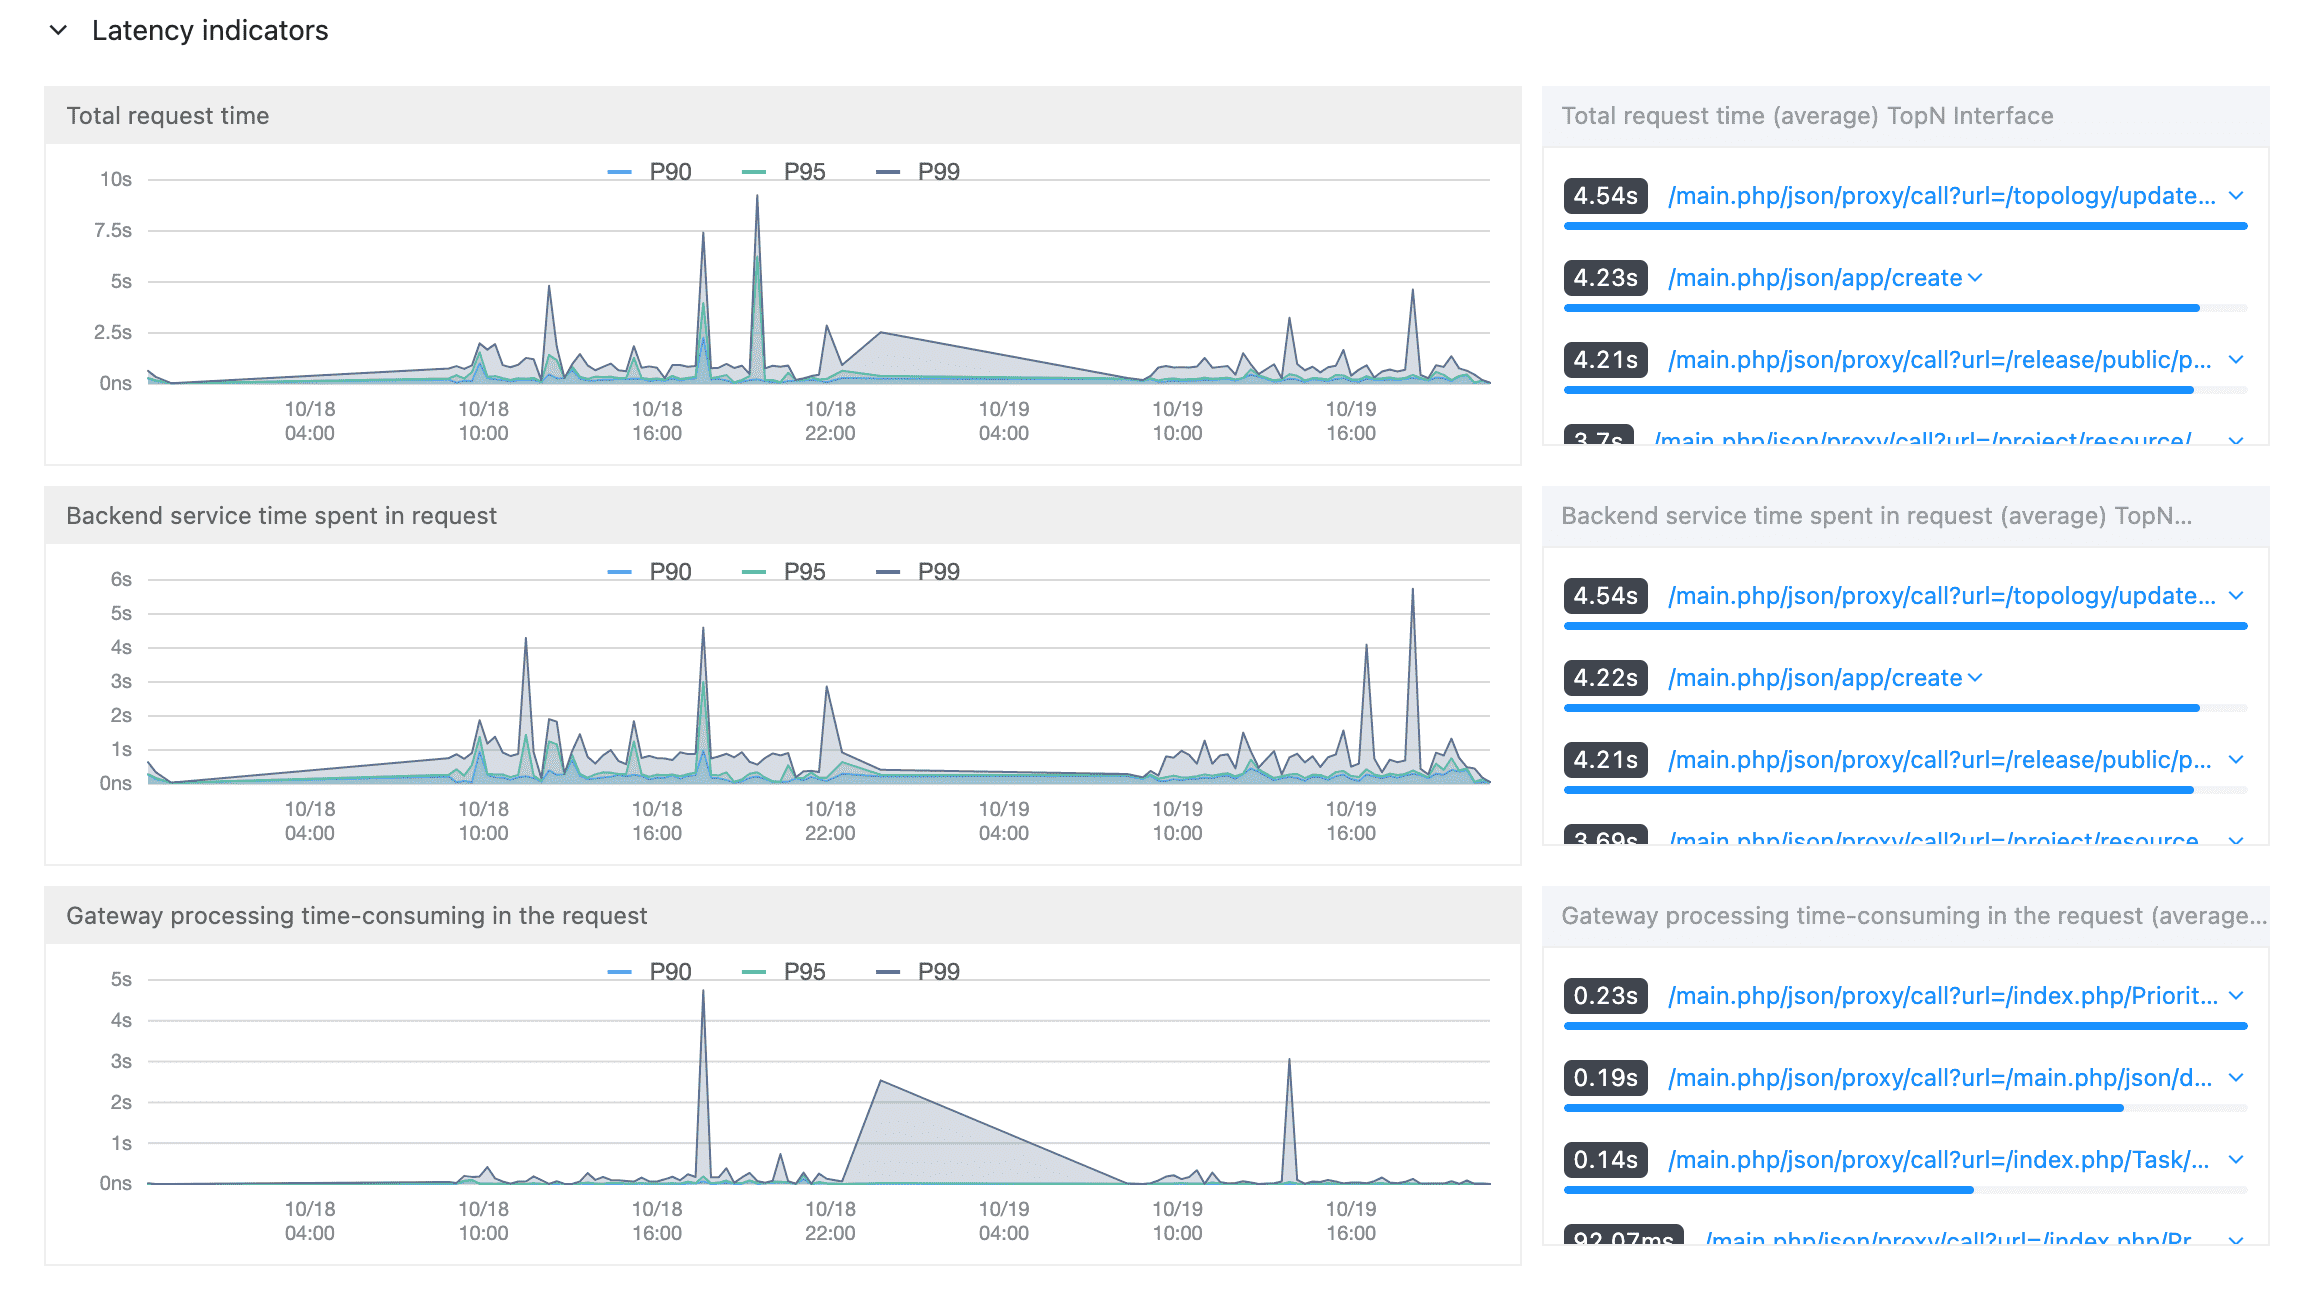
Compared with the delay indicators of the “platform perspective”, the delay indicators of the service can be observed here, and the high delay API will be sorted.
API Level #
In the “service perspective”, we see the API ranking information under the service. By clicking the corresponding API, we can further view the gateway data information of the API.

Click the API to view gateway data
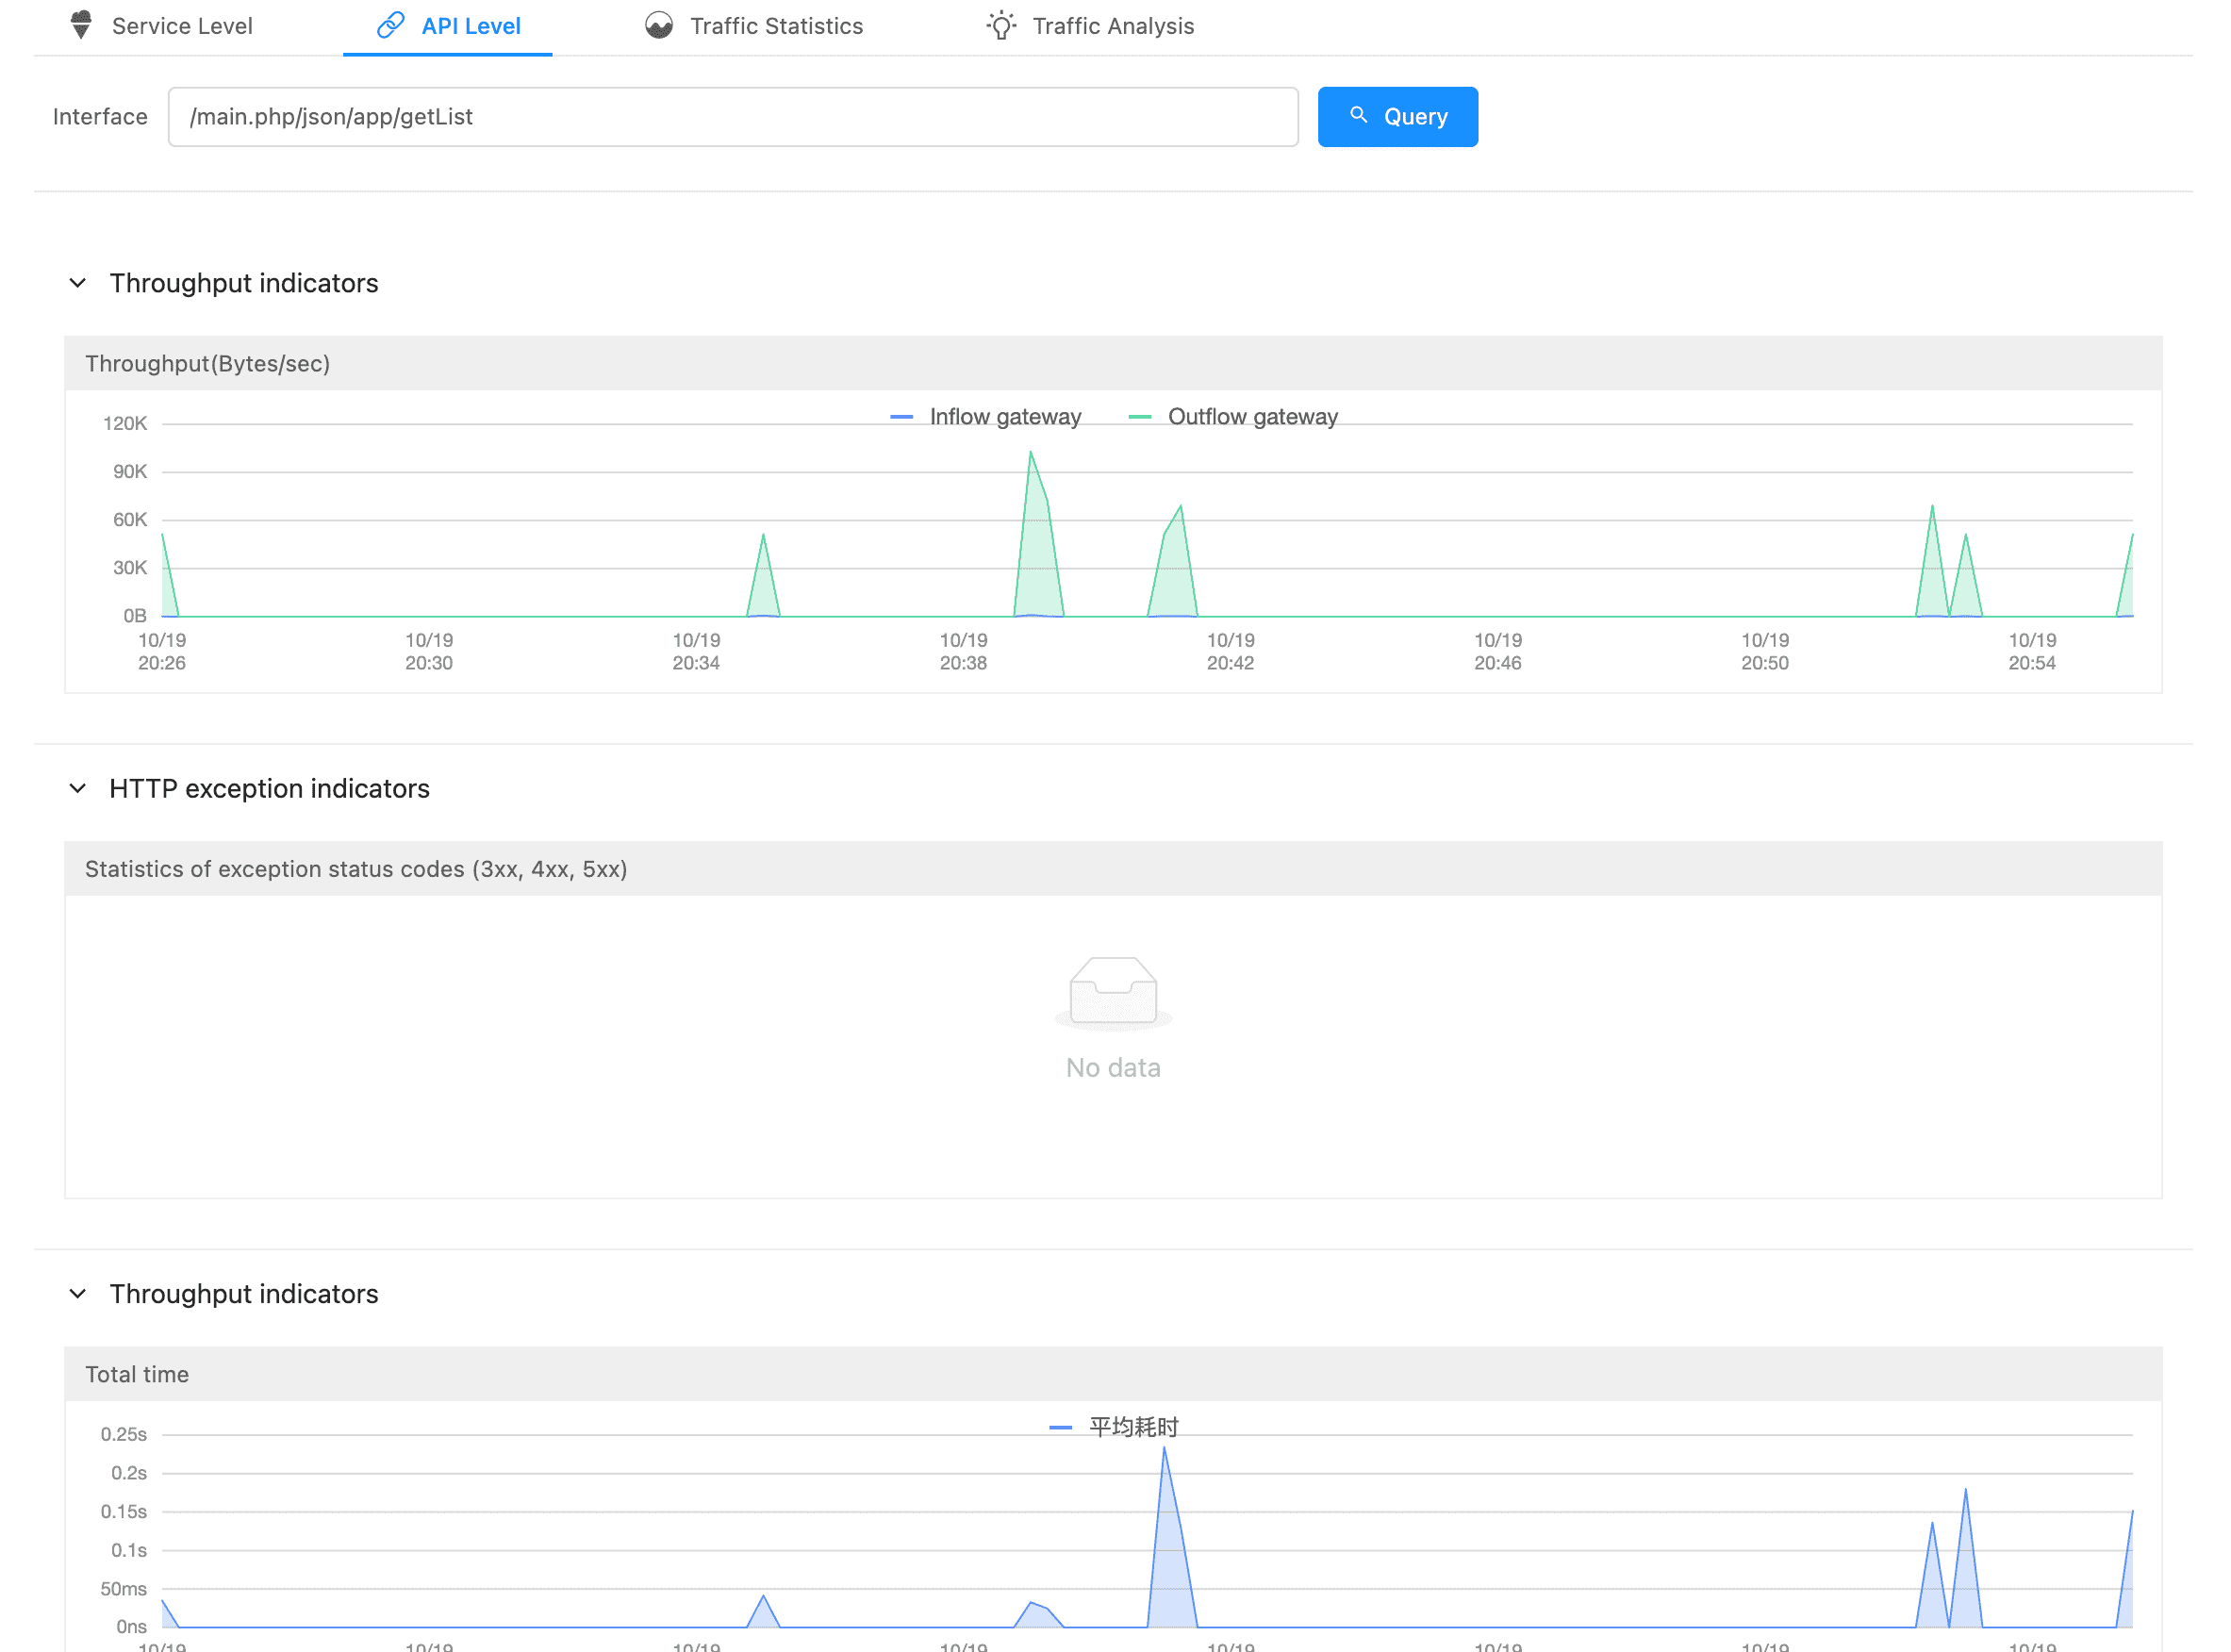
API performance