Dashboard #
Overview #
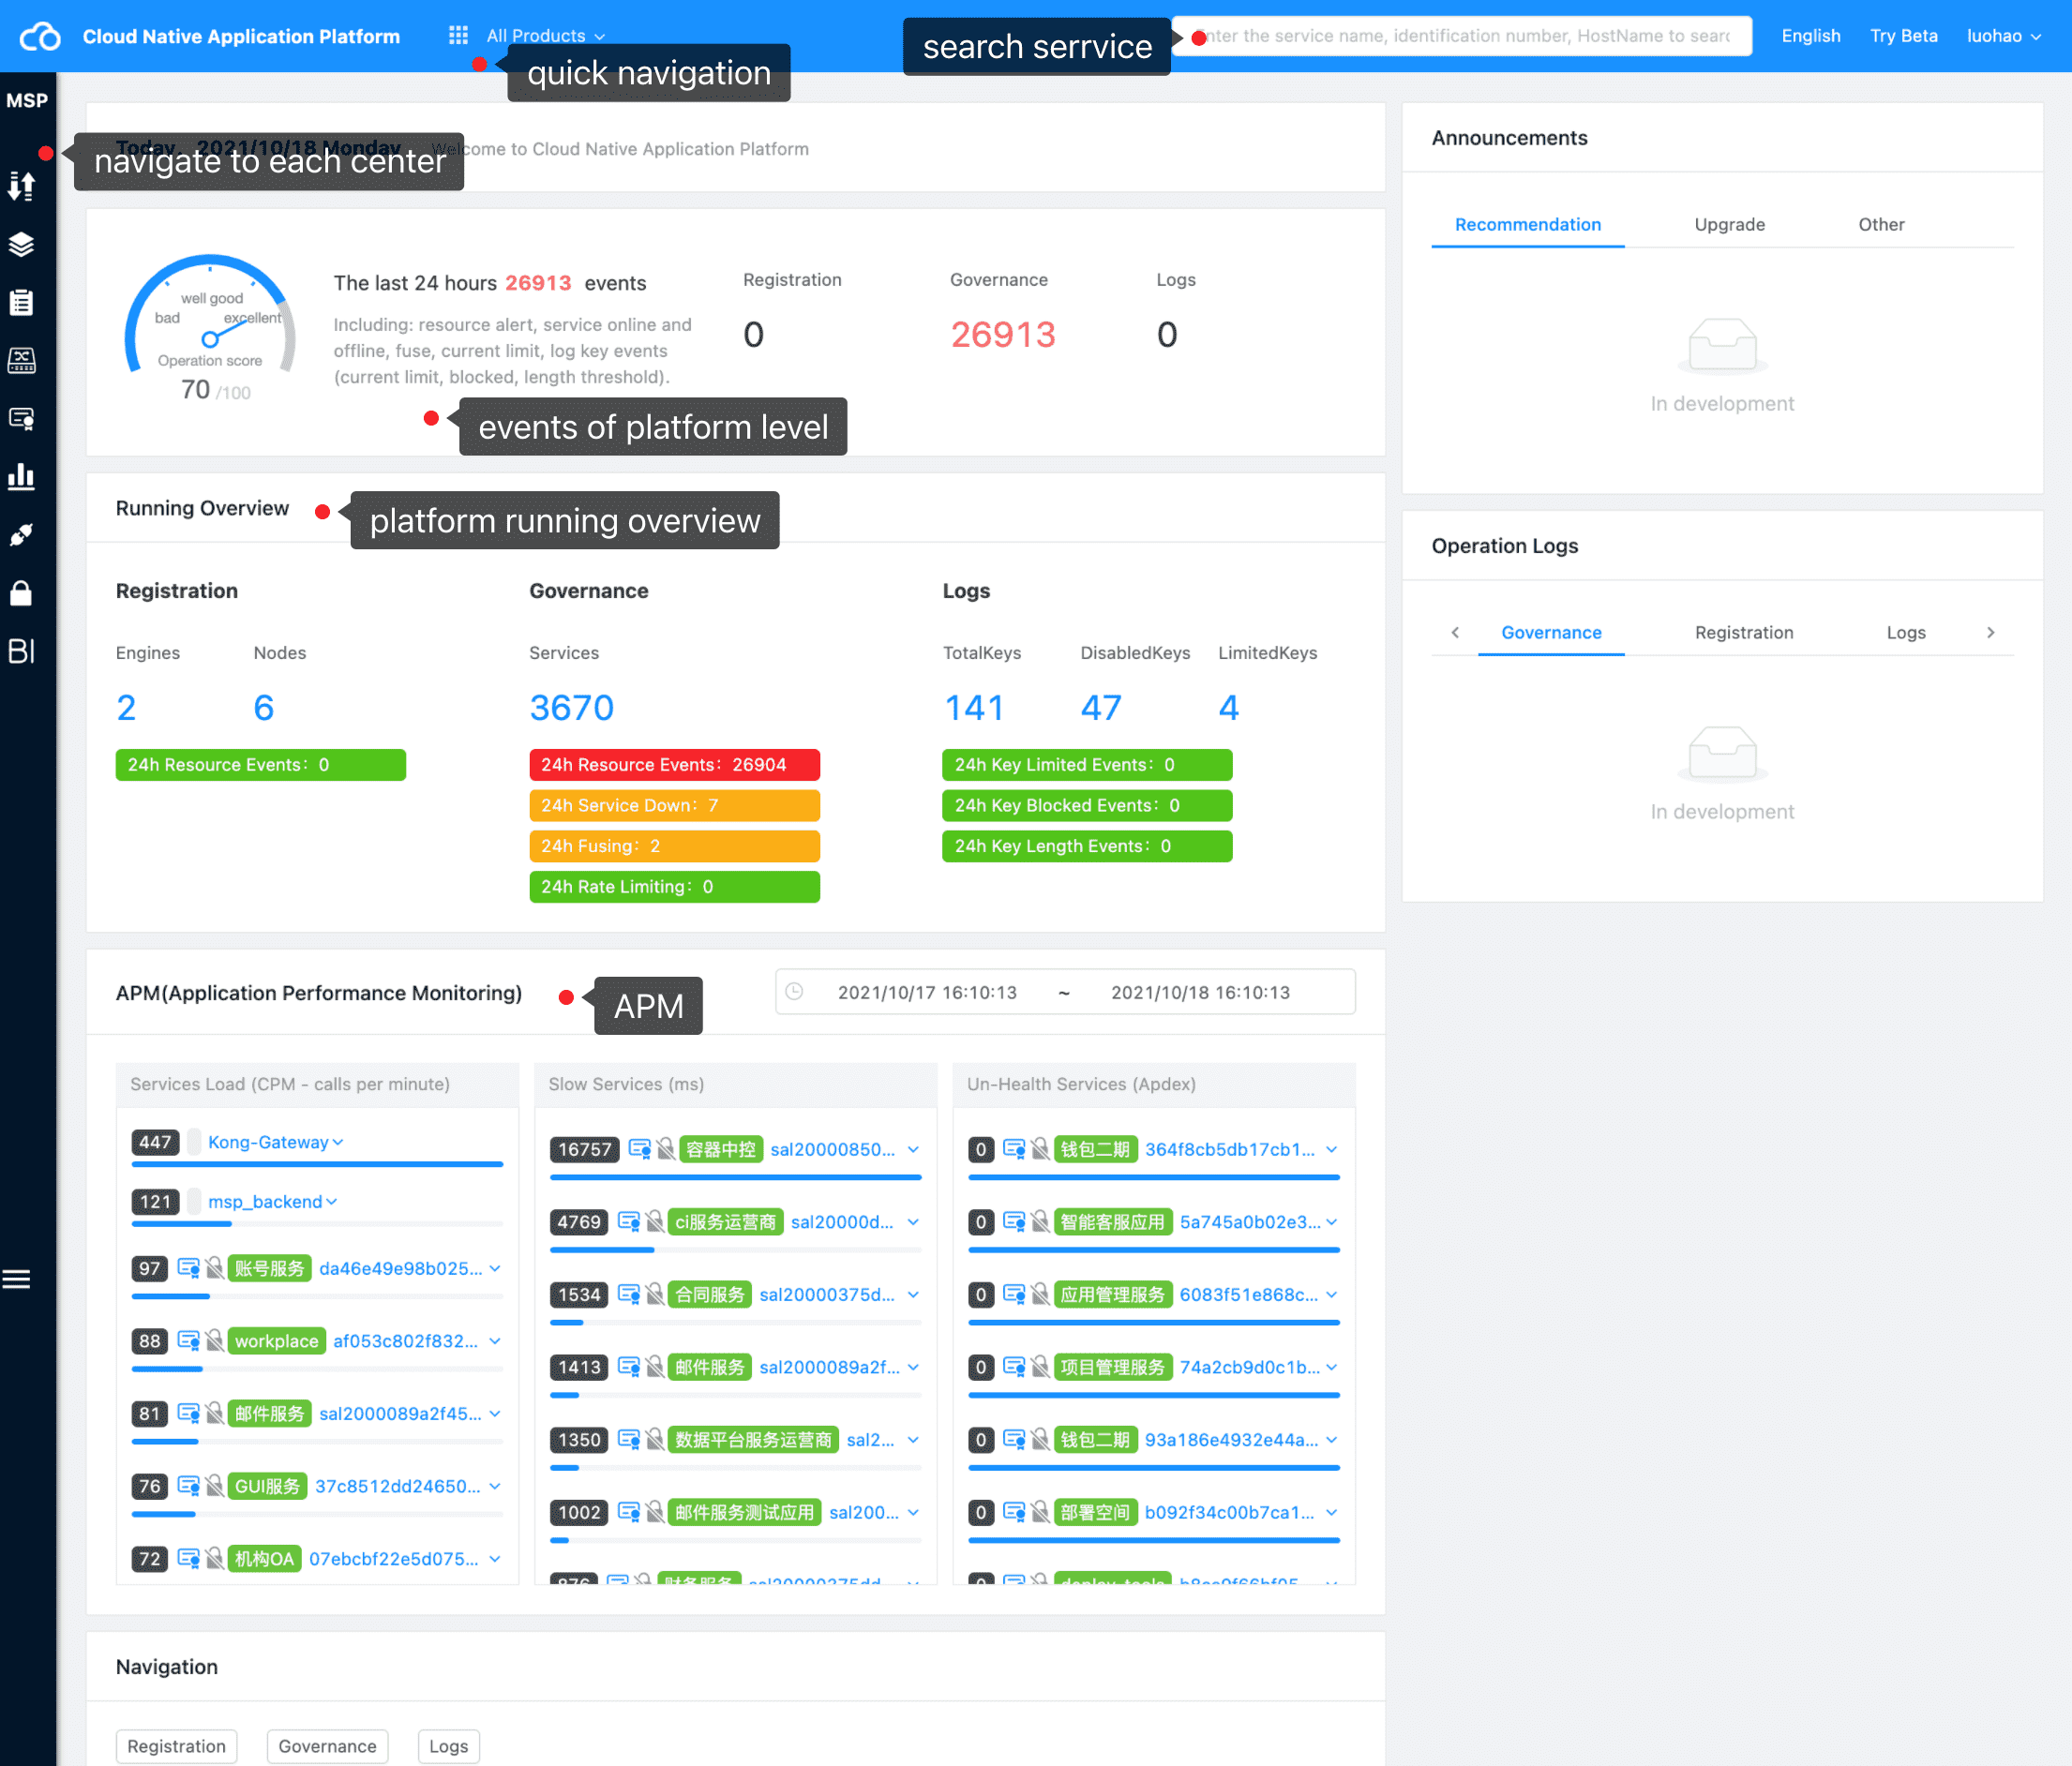
Platform dashboard view the overall access status and event overview of the system from the perspective of platform level. Different colors are used to express different semantics.
- \(\color{#1890ff}{Blue\enspace text}\) is used to describe the access of system resources, such as the number of engines, services and log keys.
- \(\color{#f56c6c}{Red\enspace text}\) used to describe new events that need attention recently.
- \(\colorbox{#52c41a}{Green\enspace background}\) indicates that there are no new events recently.
- \(\colorbox{#faad14}{Orange\enspace background}\) indicates that the number of events in this indicator is between 0 and 10, that is, the interested party needs to pay attention and troubleshoot.
- \(\colorbox{#f5222d}{Red\enspace background}\) indicates that the number of unread events of this indicator is greater than 10, which needs the attention of the interested party.
Best Practice #
After logging into the platform, if the user sees that all events to be concerned are \(\colorbox{#52c41a}{green}\) , it means that the system is running well and no new unread events are reported.
If \(\colorbox{#f5222d}{red}\) is found after logging in the platform, it indicates that the current system needs attention. Users can click the corresponding indicator to view the corresponding event.
Modules #
Top Bar #
The top bar includes the following main functions: Fast navigation, service search and language switching.
All Products #
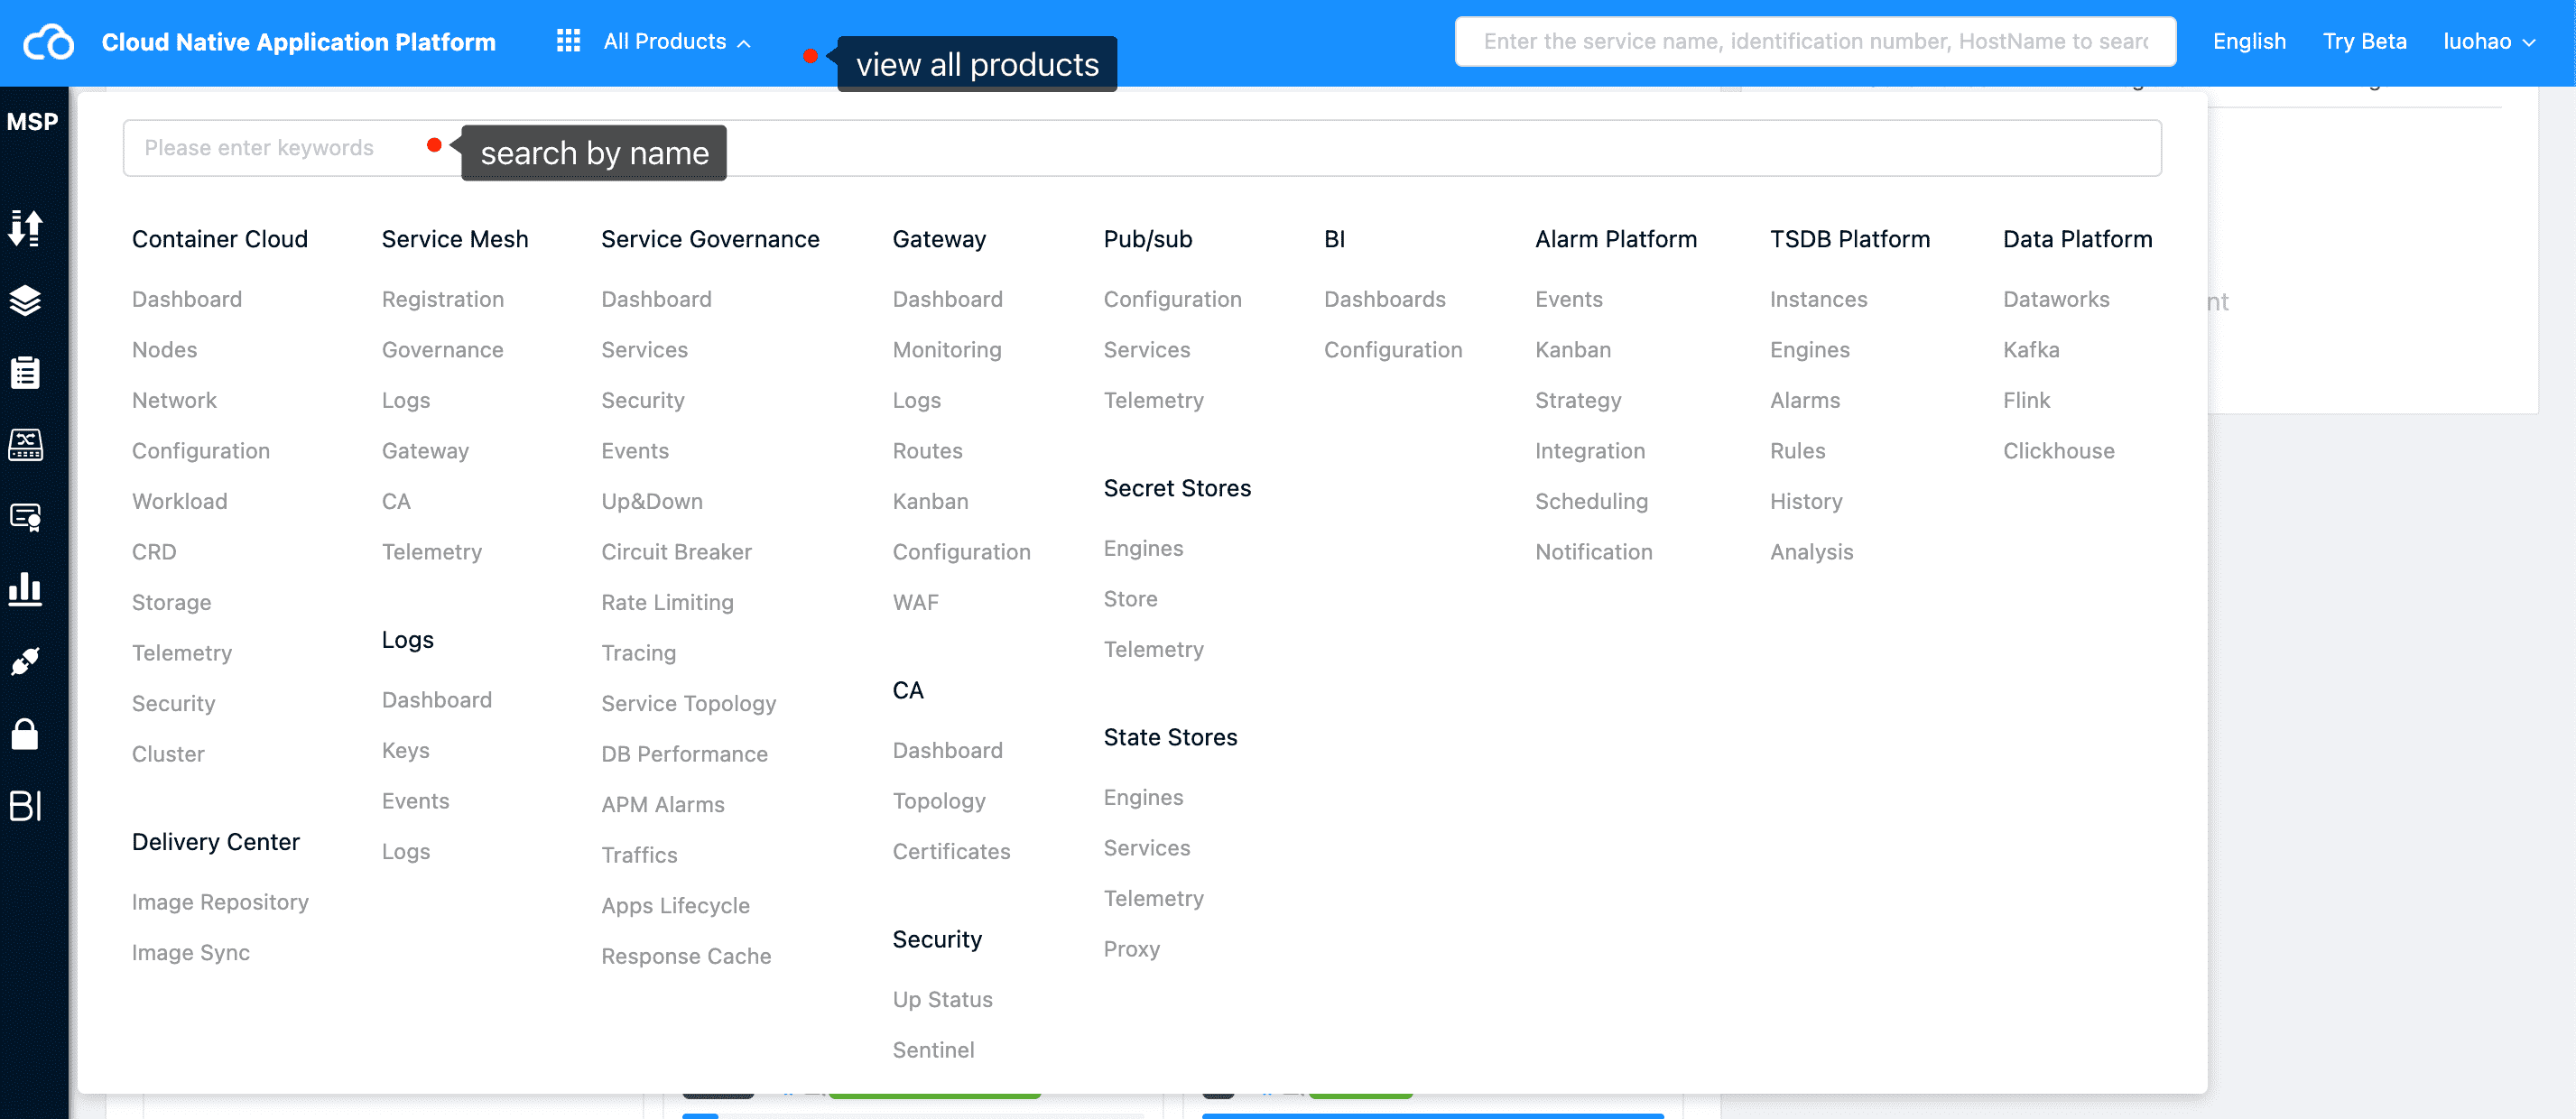
Through the “All Products”, we can go directly to the sub functions of the cloud native application platform. At the same time, the module also supports search operation.
Service Search #
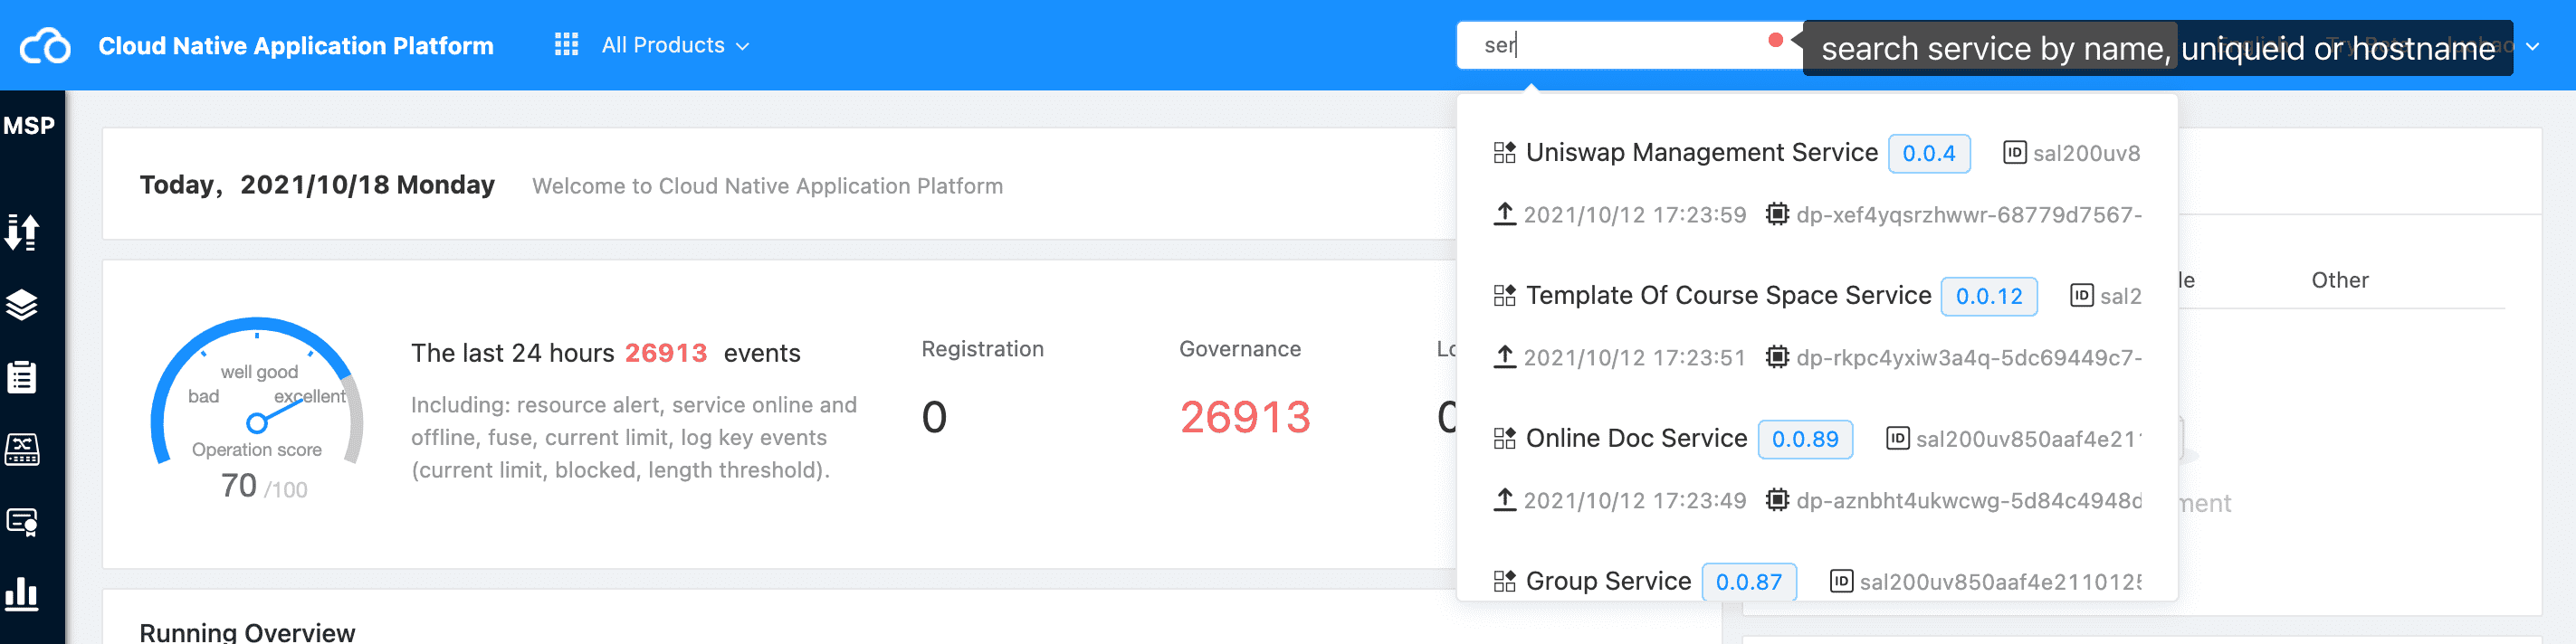
When we need to care about a specific service, we can directly search here through the “name”, “uniqueId” and “hostname” information of the service to directly enter the governance details of the service.
Switch Language #
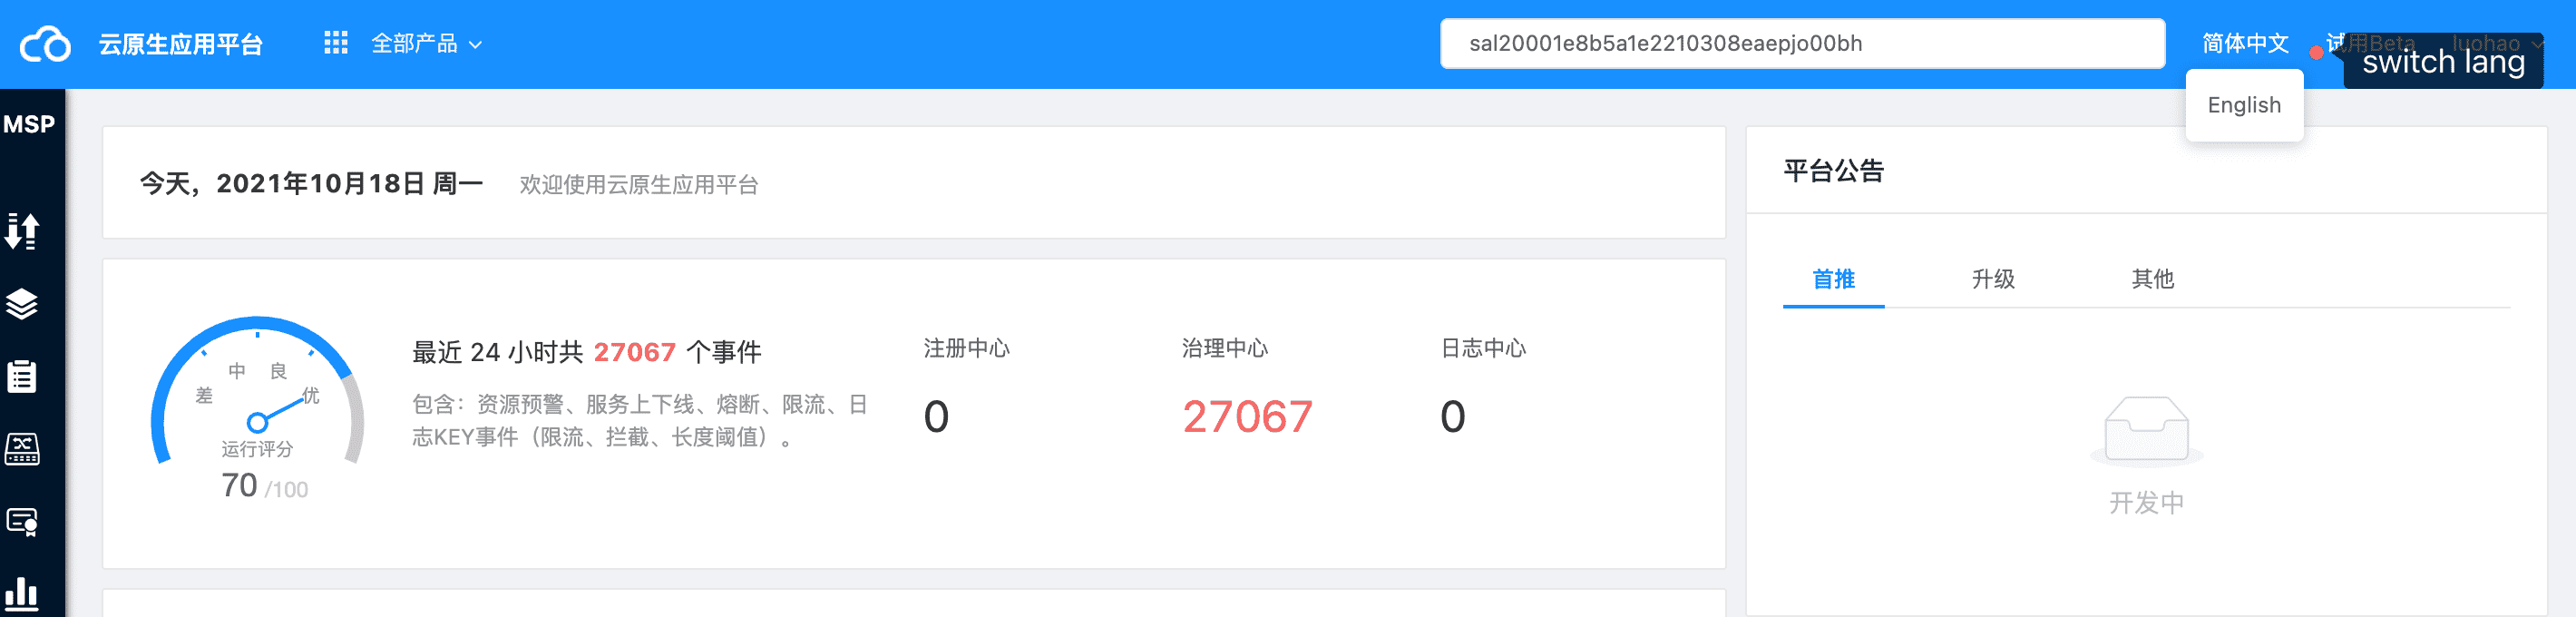
By clicking the corresponding language, we can easily switch languages.
Left Bar #
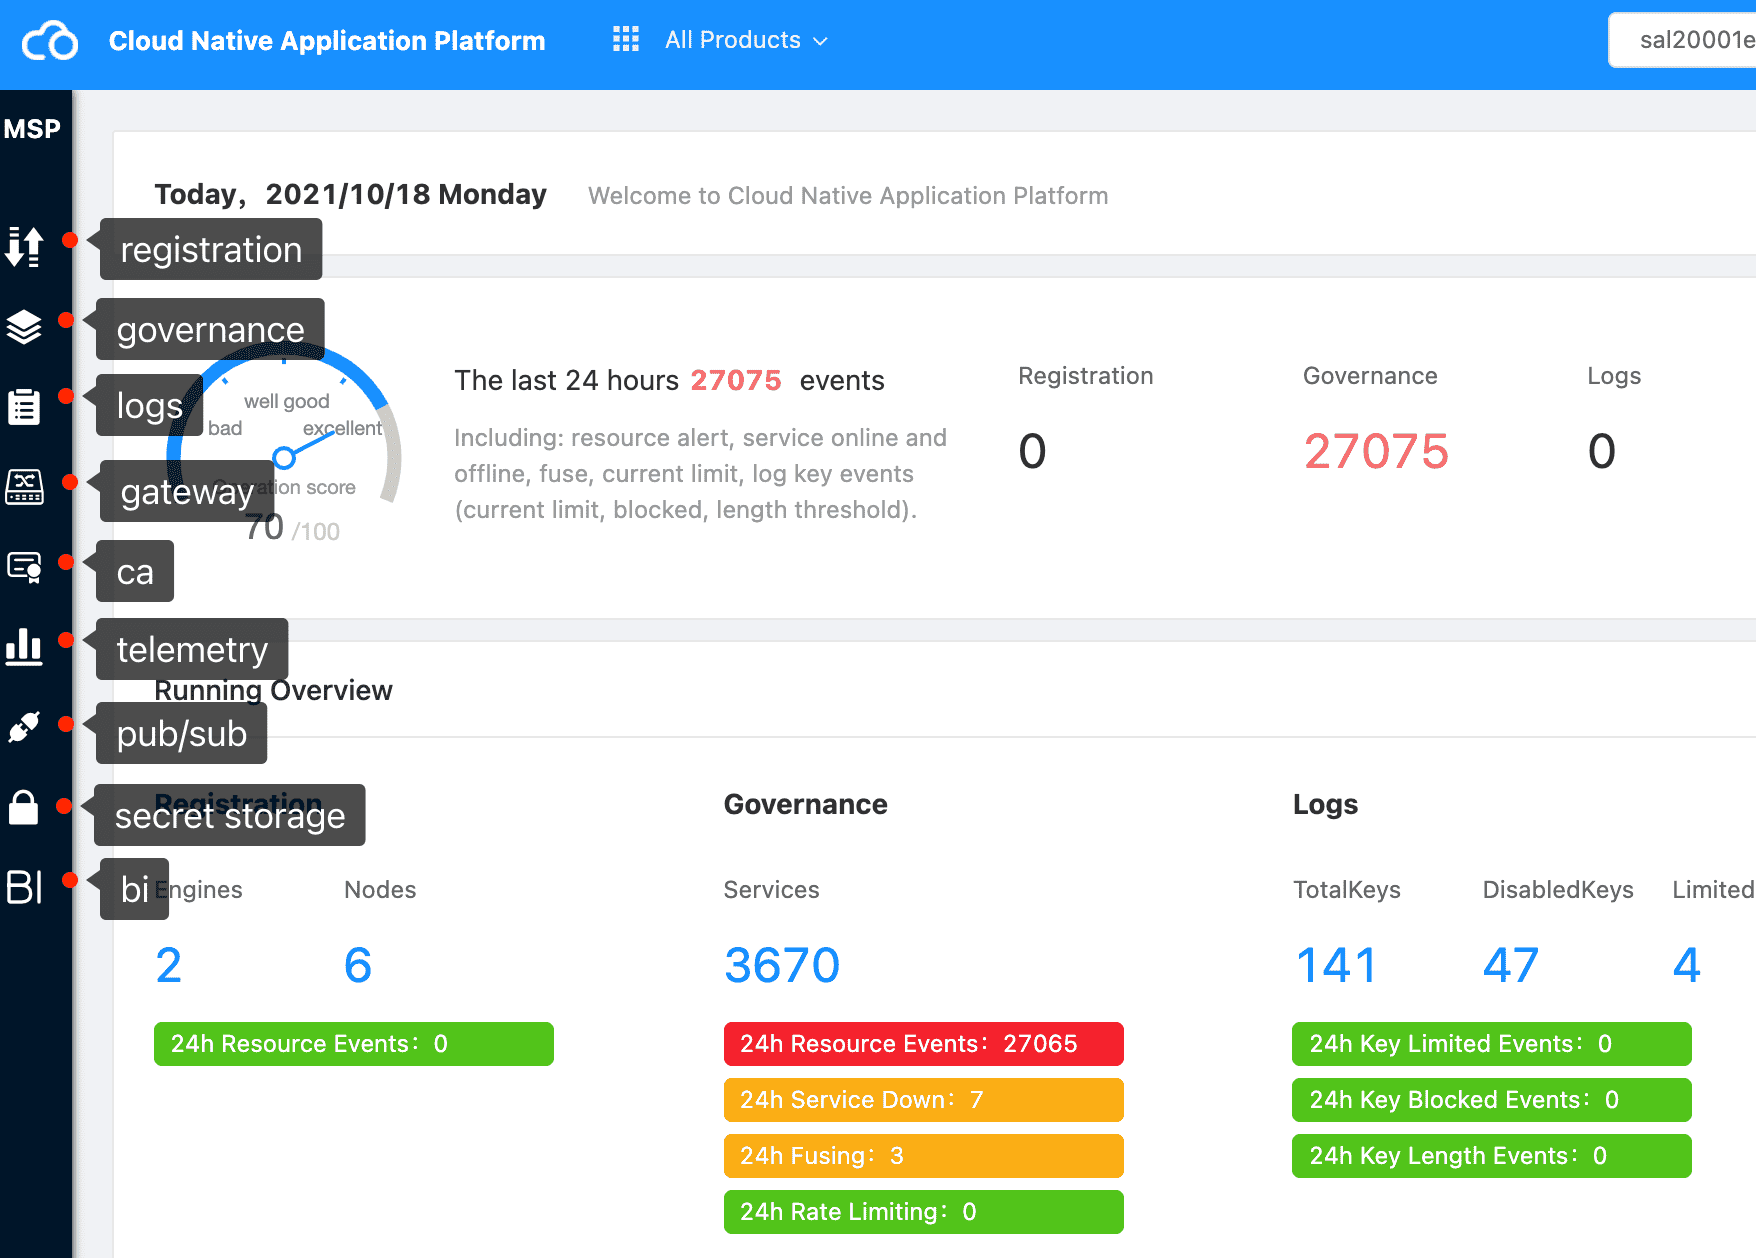
Click each icon to switch to different function centers.
Platform Events #

The pending events card summarizes the pending events of the three centers. Its value is the sum of all unread events in each center. Click the corresponding value to view unread events.
Note: the specific algorithm of “operation score” of the platform has not been determined yet. It is determined after data sampling and analysis after the platform has operated for a period of time.
Runing Overview #
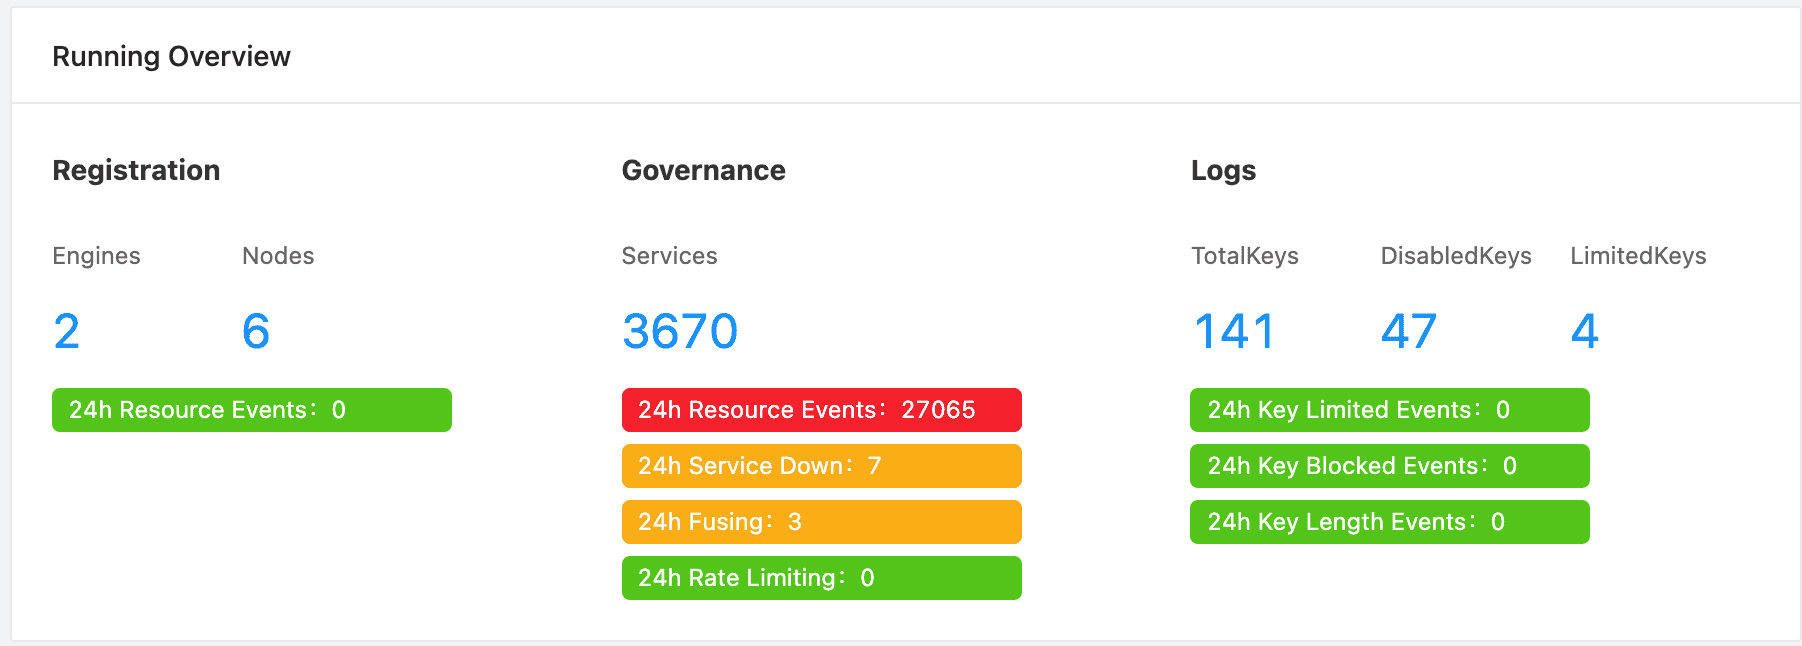
The running overview card displays the access status of each center and the event statistics of various indicators. Using this function in combination with the color semantics and best practices mentioned earlier can get twice the result with half the effort.
Application Performace Monitoring #
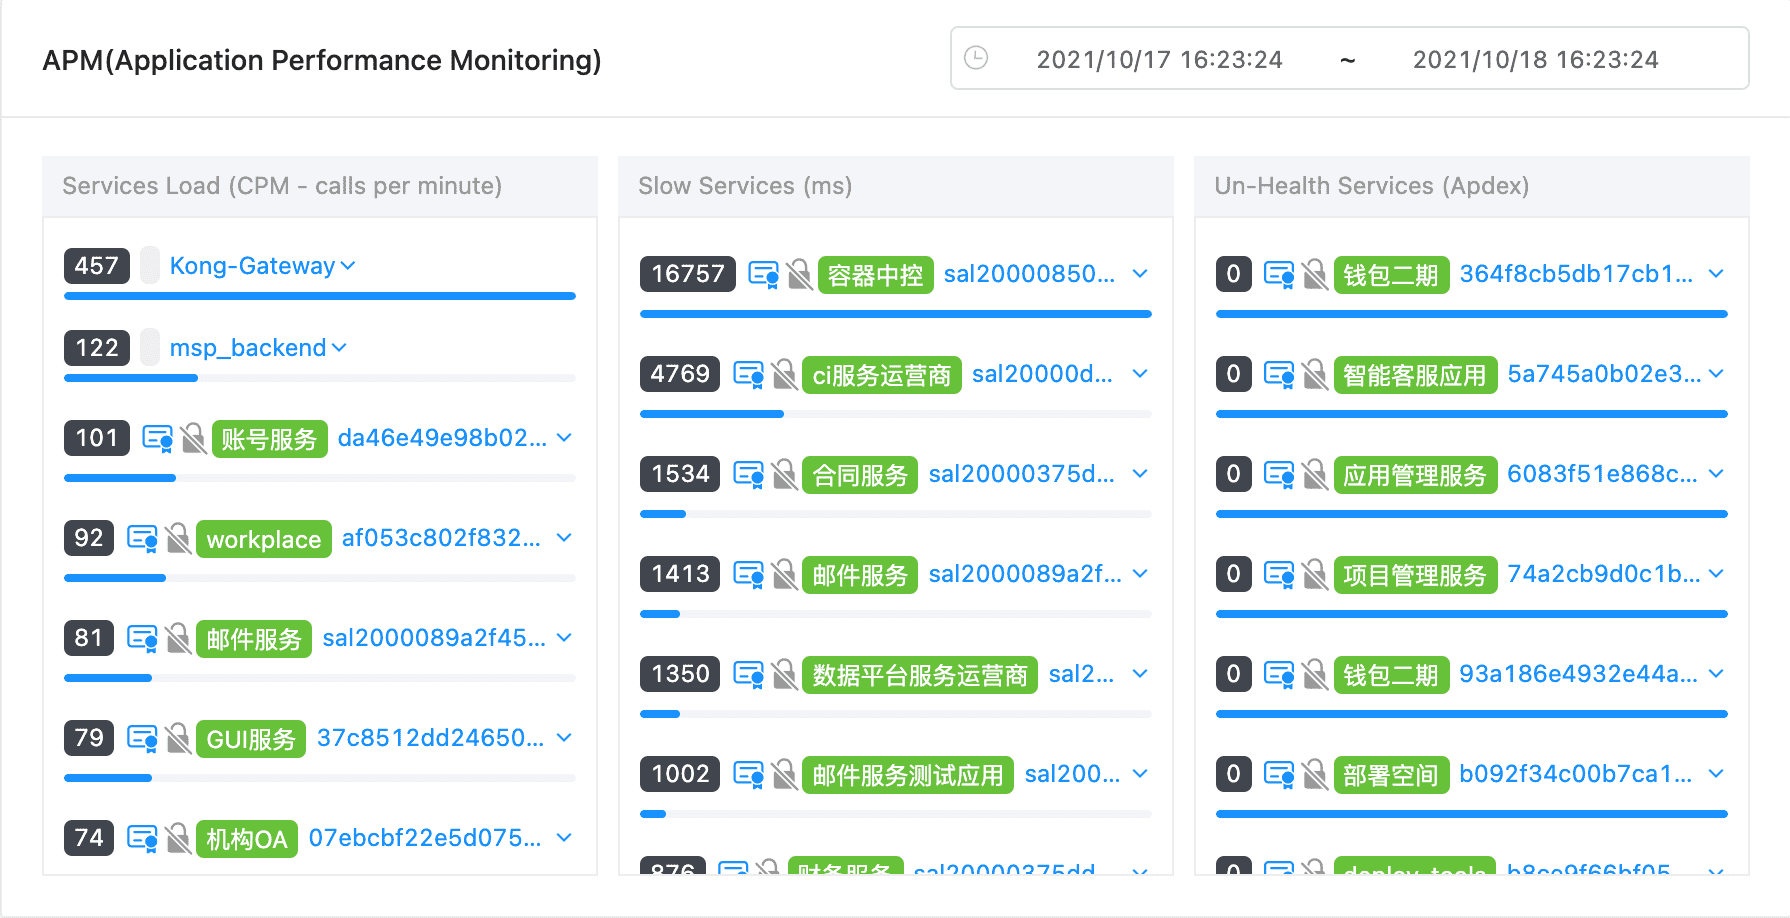
Displays the APM (application performance monitoring) information ranking of the service. At present, the displayed information is
- Service load ranking, requests per minute
- Service slow response ranking
- Service health ranking
Click the service name to pop up a menu to view more details of the service.
Navigation #

The common function is the quick navigation portal of the platform. Other common links can also be included in the later stage, which can aggregate common system links inside and outside the platform for MSP users.