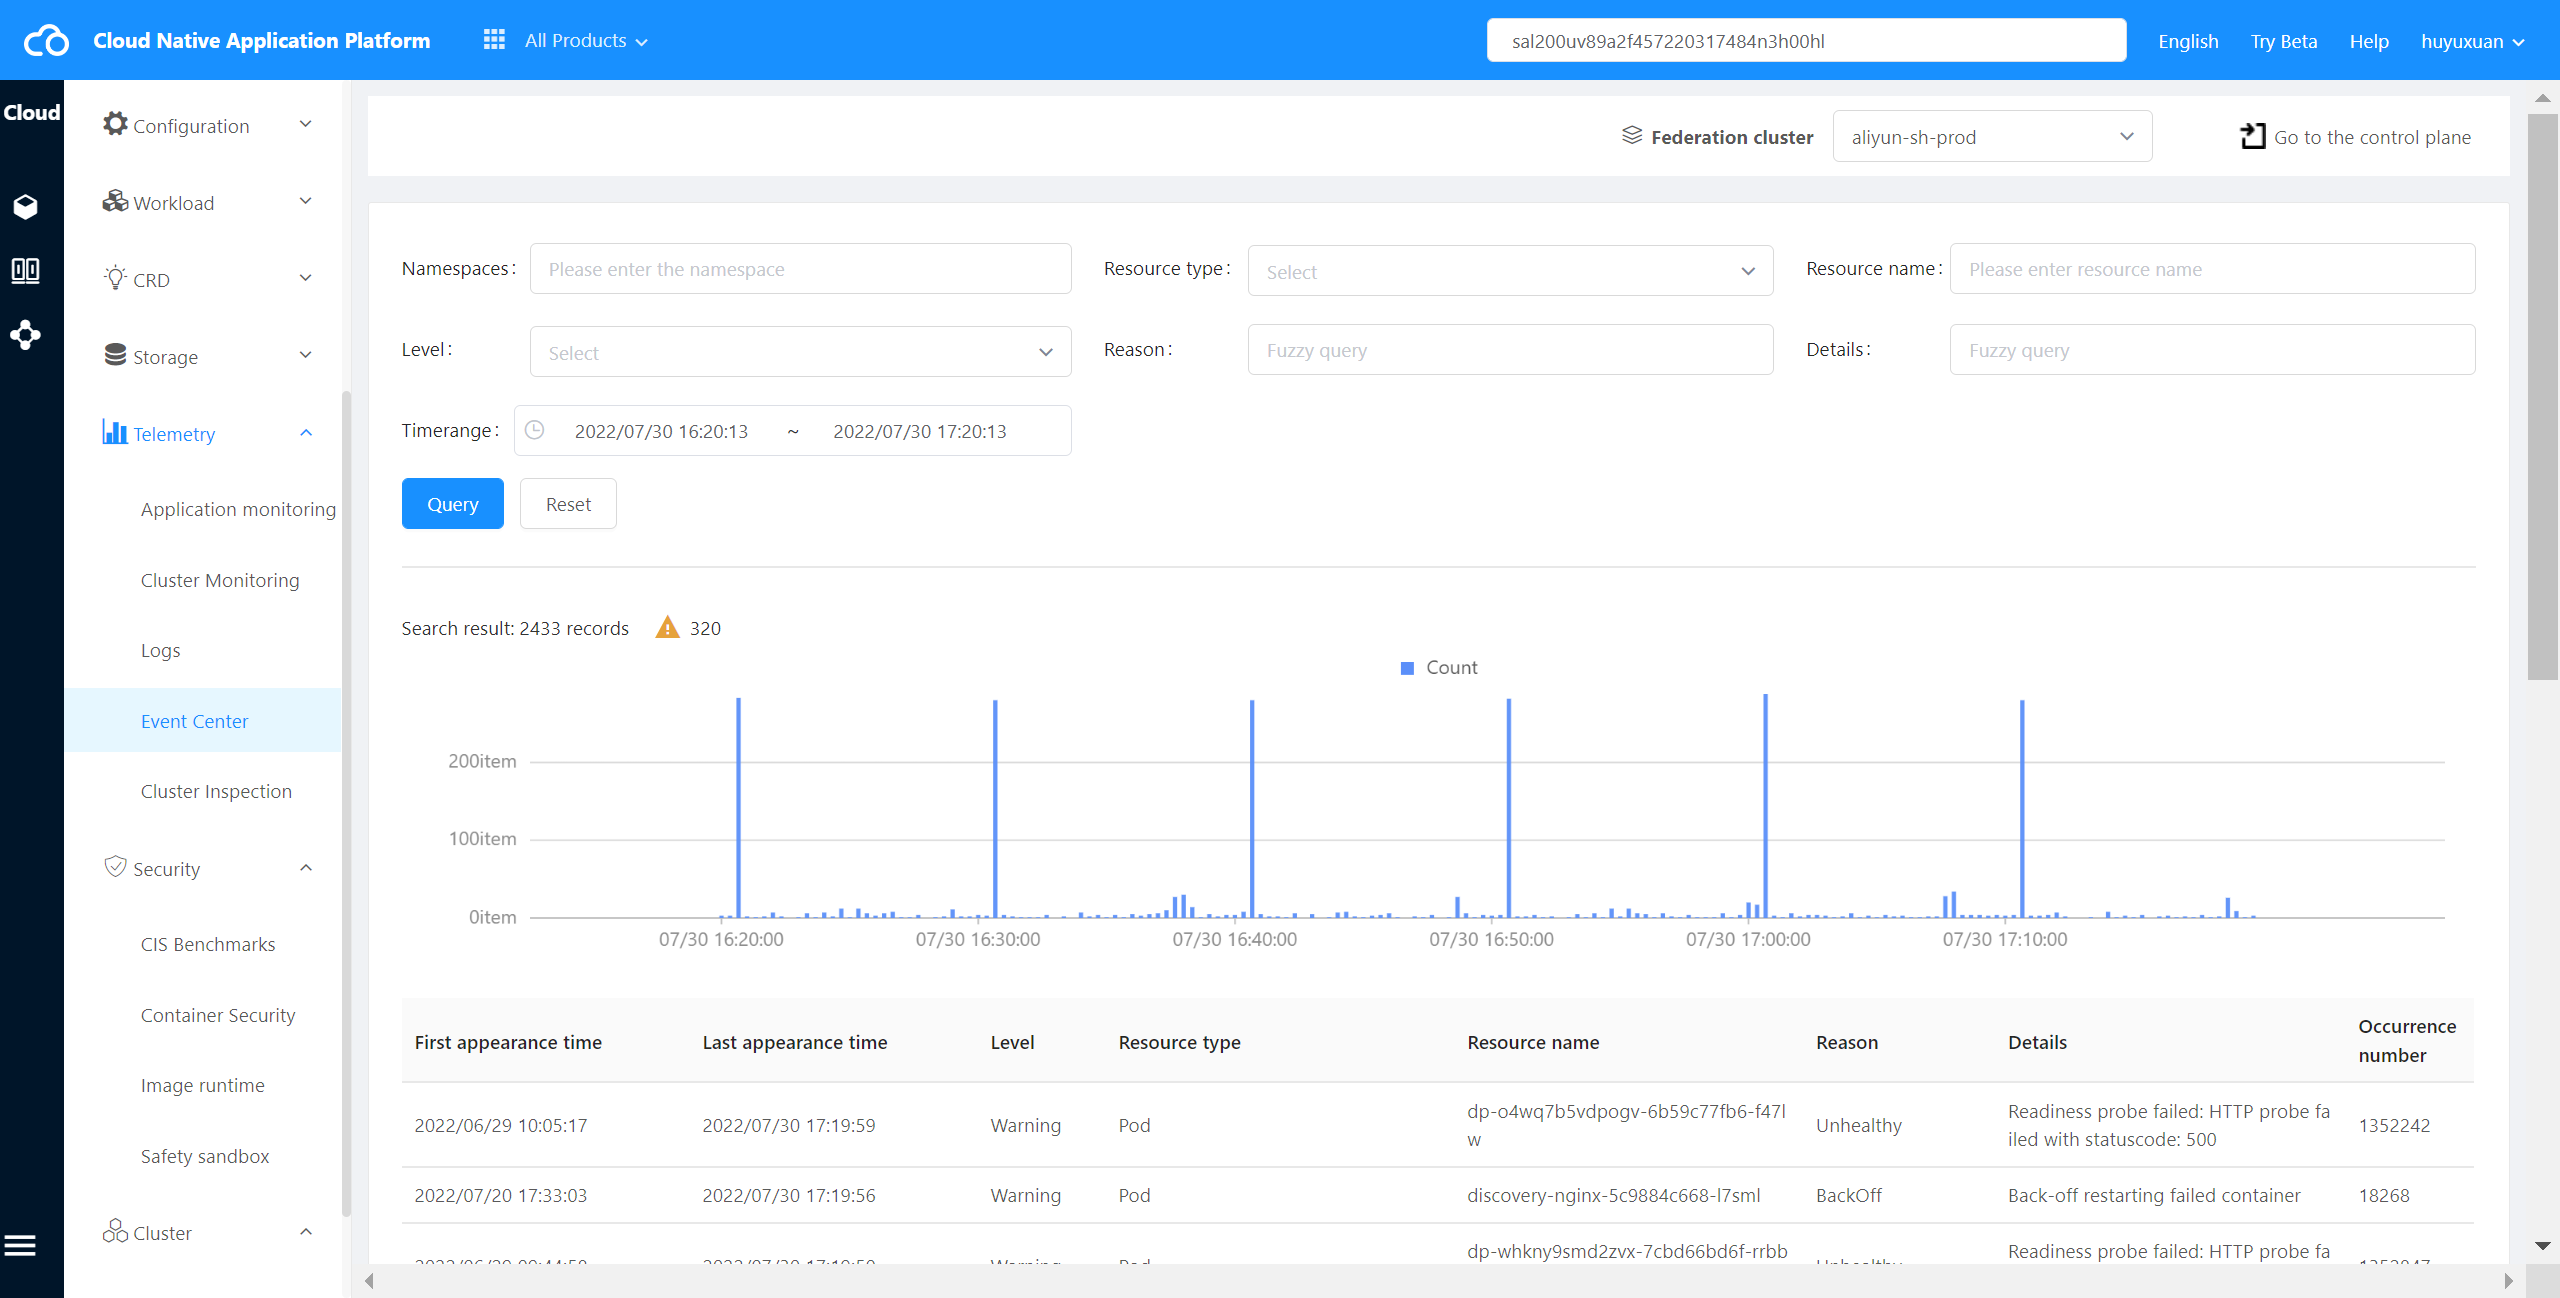
Event Center #
On the “Event Center” page,you can filter events according to dimensions such as time, namespace, level, reason, resource type, resource object, etc.,view the summary statistics of core events,and show the data comparison in a period.For example,dashboards such as the total number and distribution of events, node anomalies, Pod OOM, important event trends, and list of abnormal TOP events.
Operating steps:
Log in the MSP Platform
In the MSP Platform “All Products” navigation bar,click the Telemetry under the Container Cloud Platform module,click Event Center in the right navigation bar,as shown in the following figure: