Cluster Monitoring #
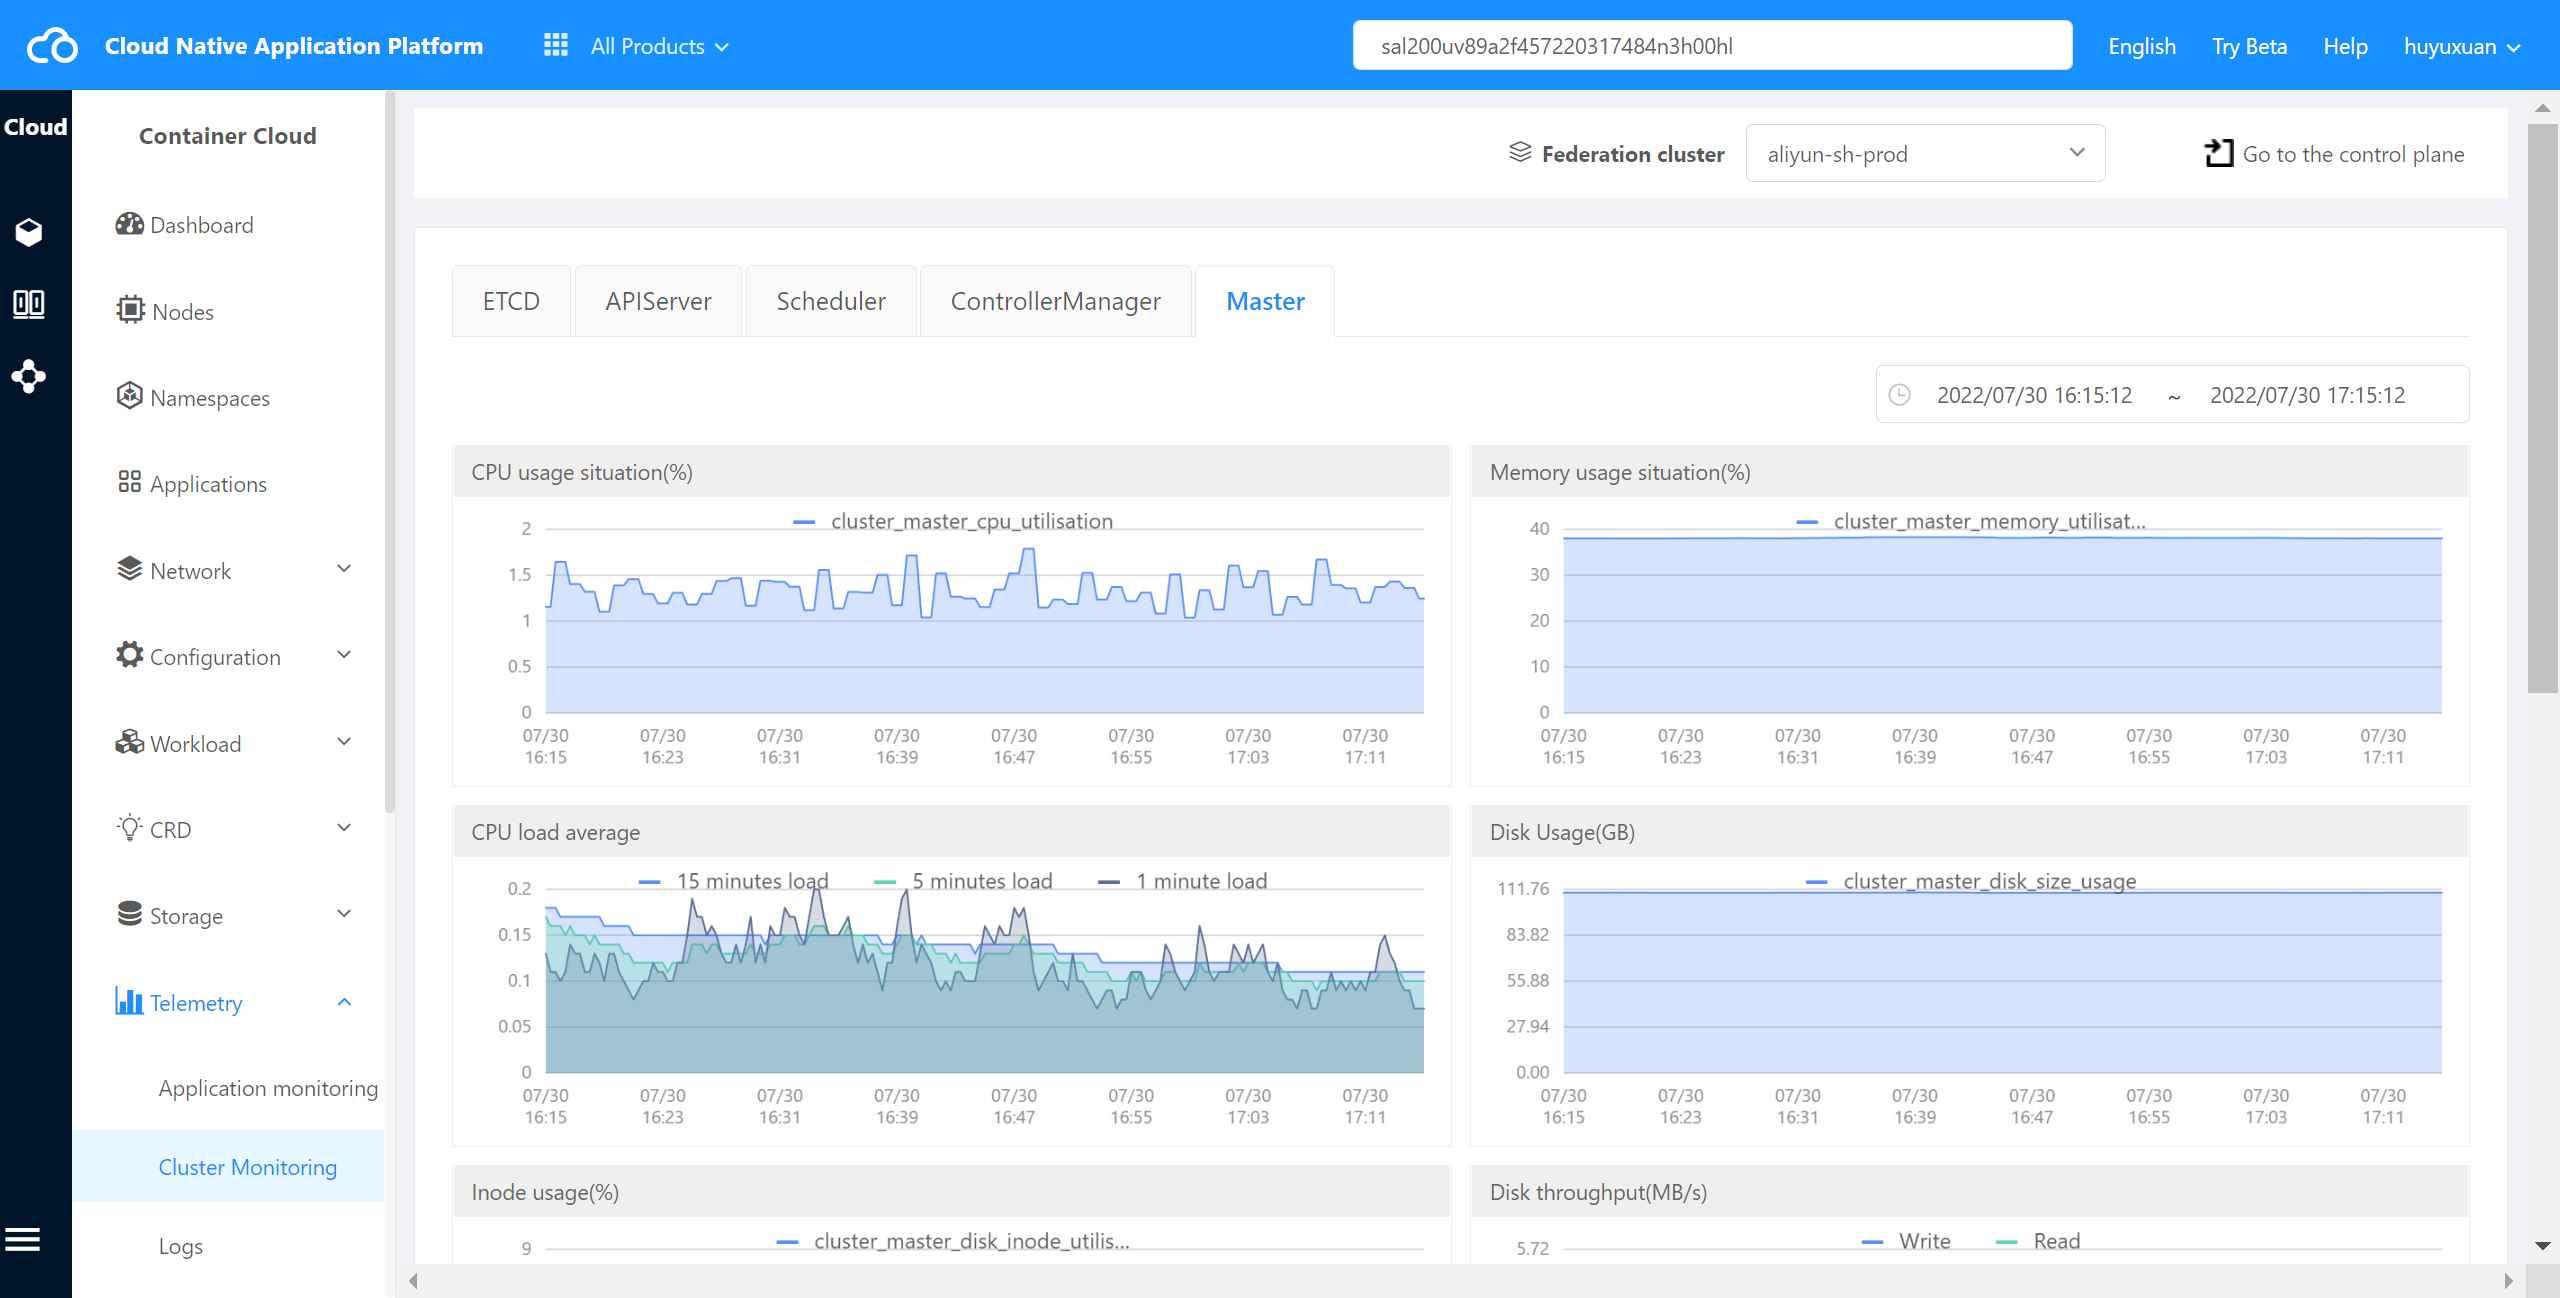
Cluster monitoring is the monitoring of the core system components (ETCD, APIServer, scheduler, Maste) in Kubernetes cluster.
Operating steps:
Log in the MSP Platform
In the MSP Platform “All Products” navigation bar,click the Telemetry under the Container Cloud Platform module,click Cluster Monitoring in the right navigation bar,as shown in the following figure:
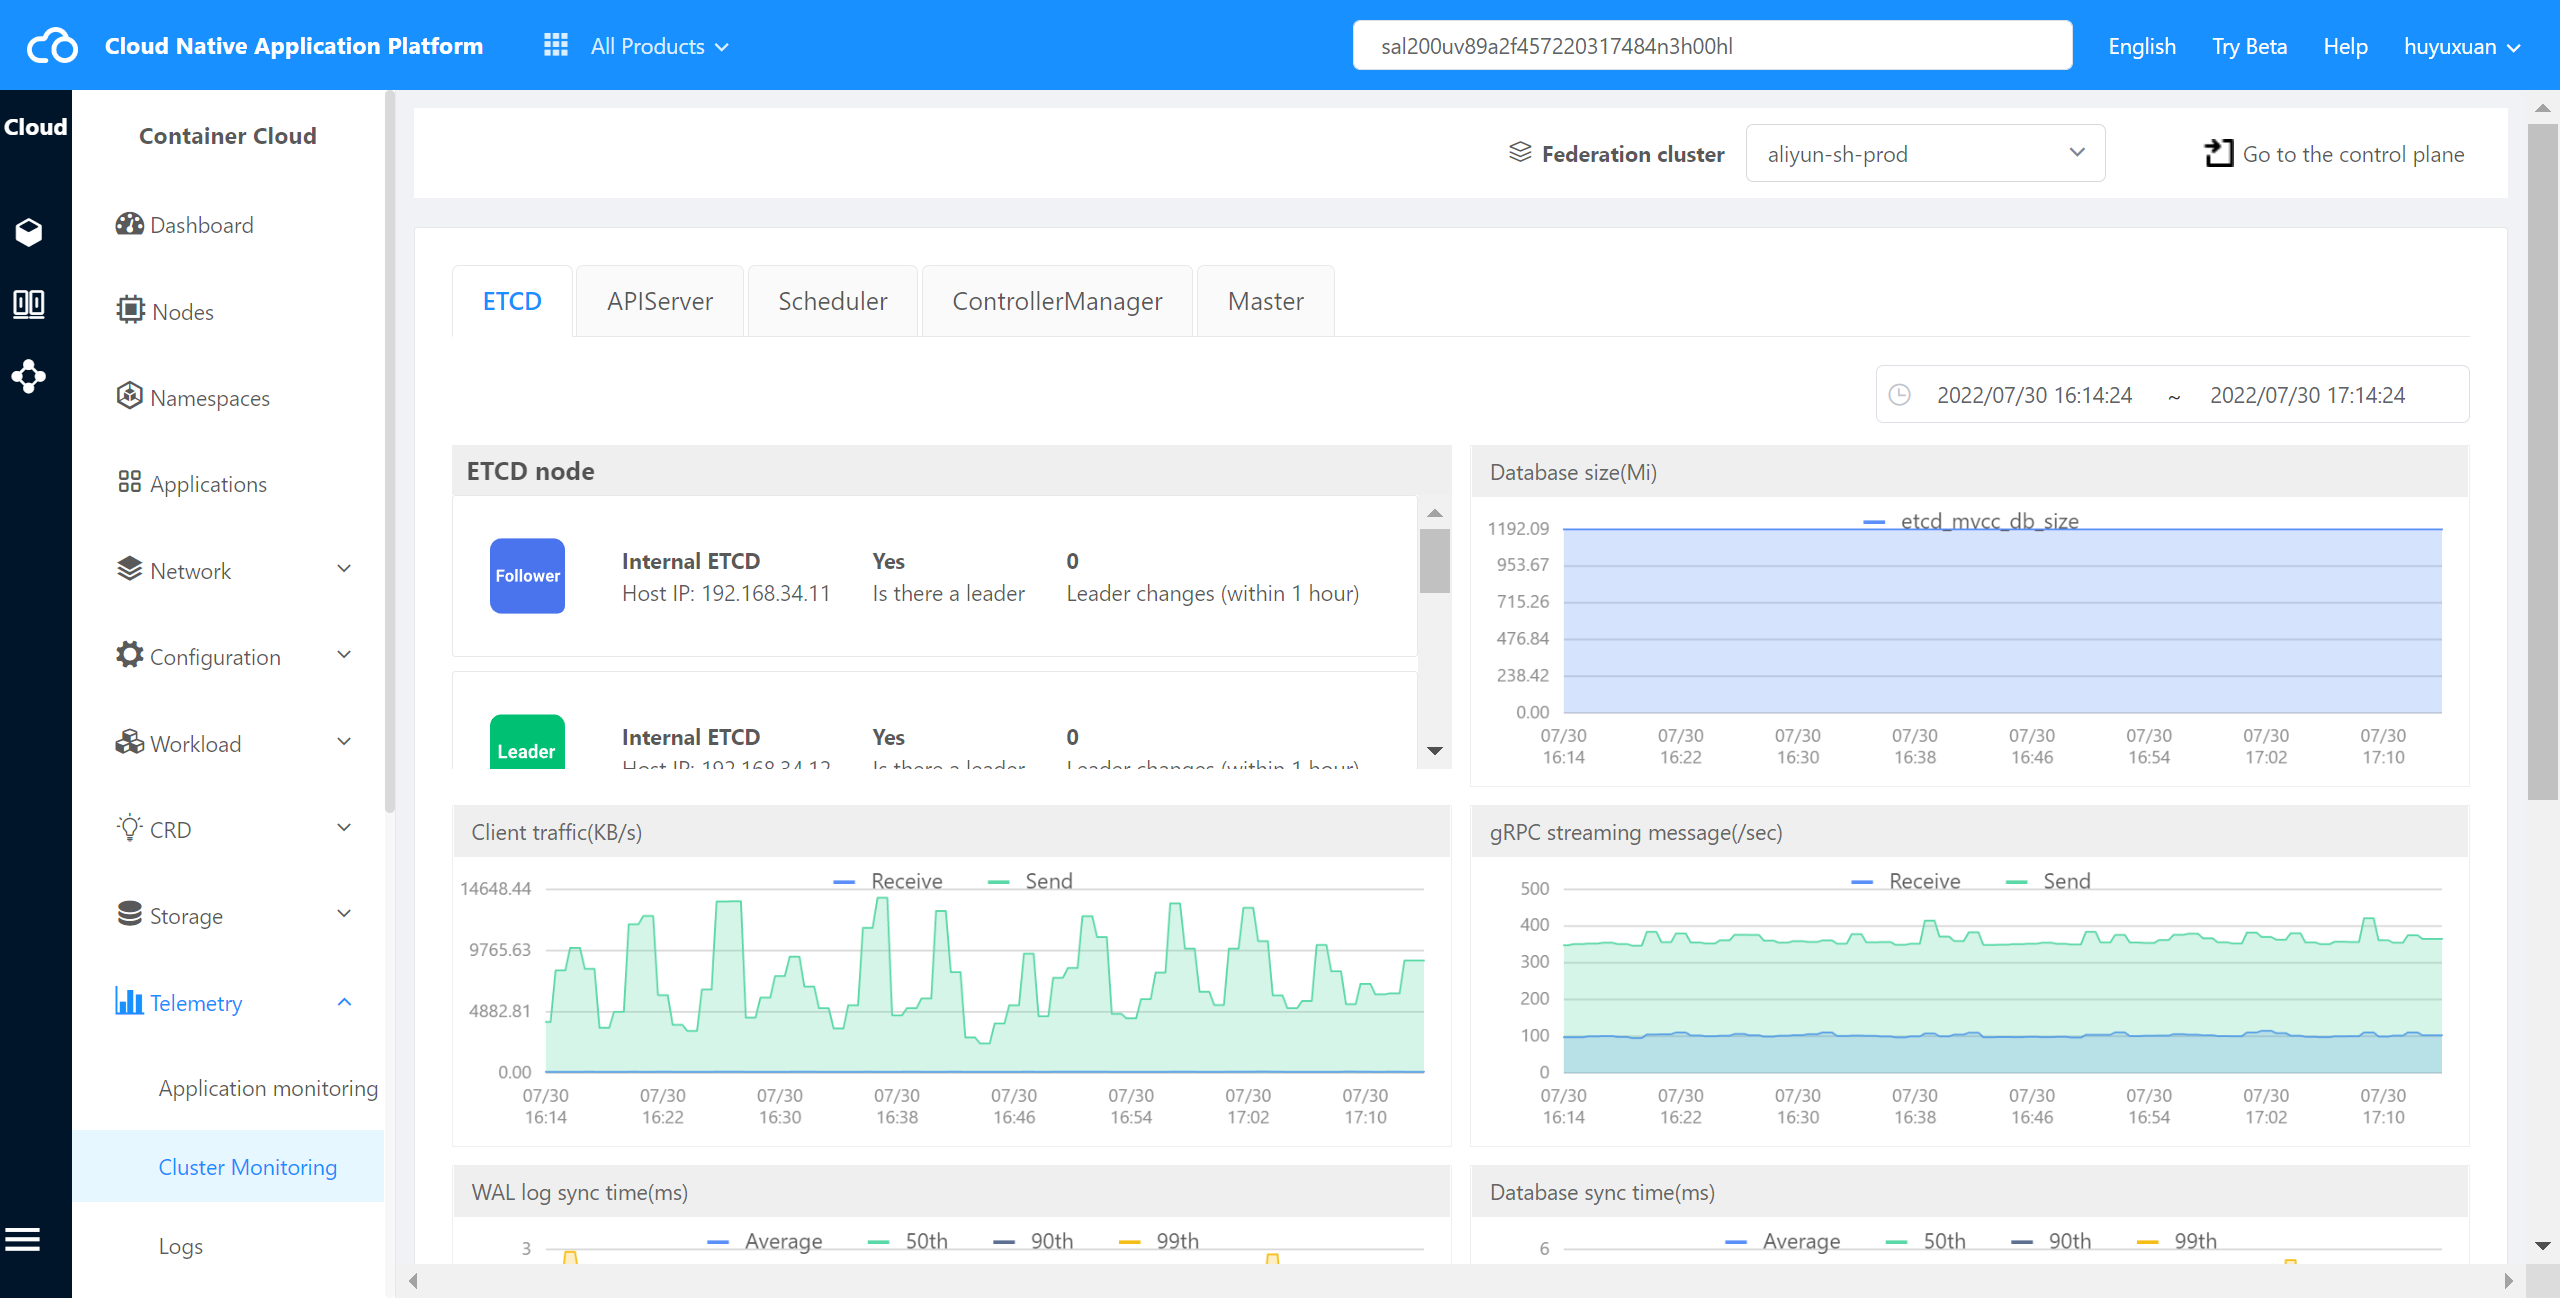
The etcd monitoring indicators include: ETCD node information in the cluster, library size, client traffic, gRPC streaming messages, WAL log synchronization time, library synchronization time and Raft proposal.
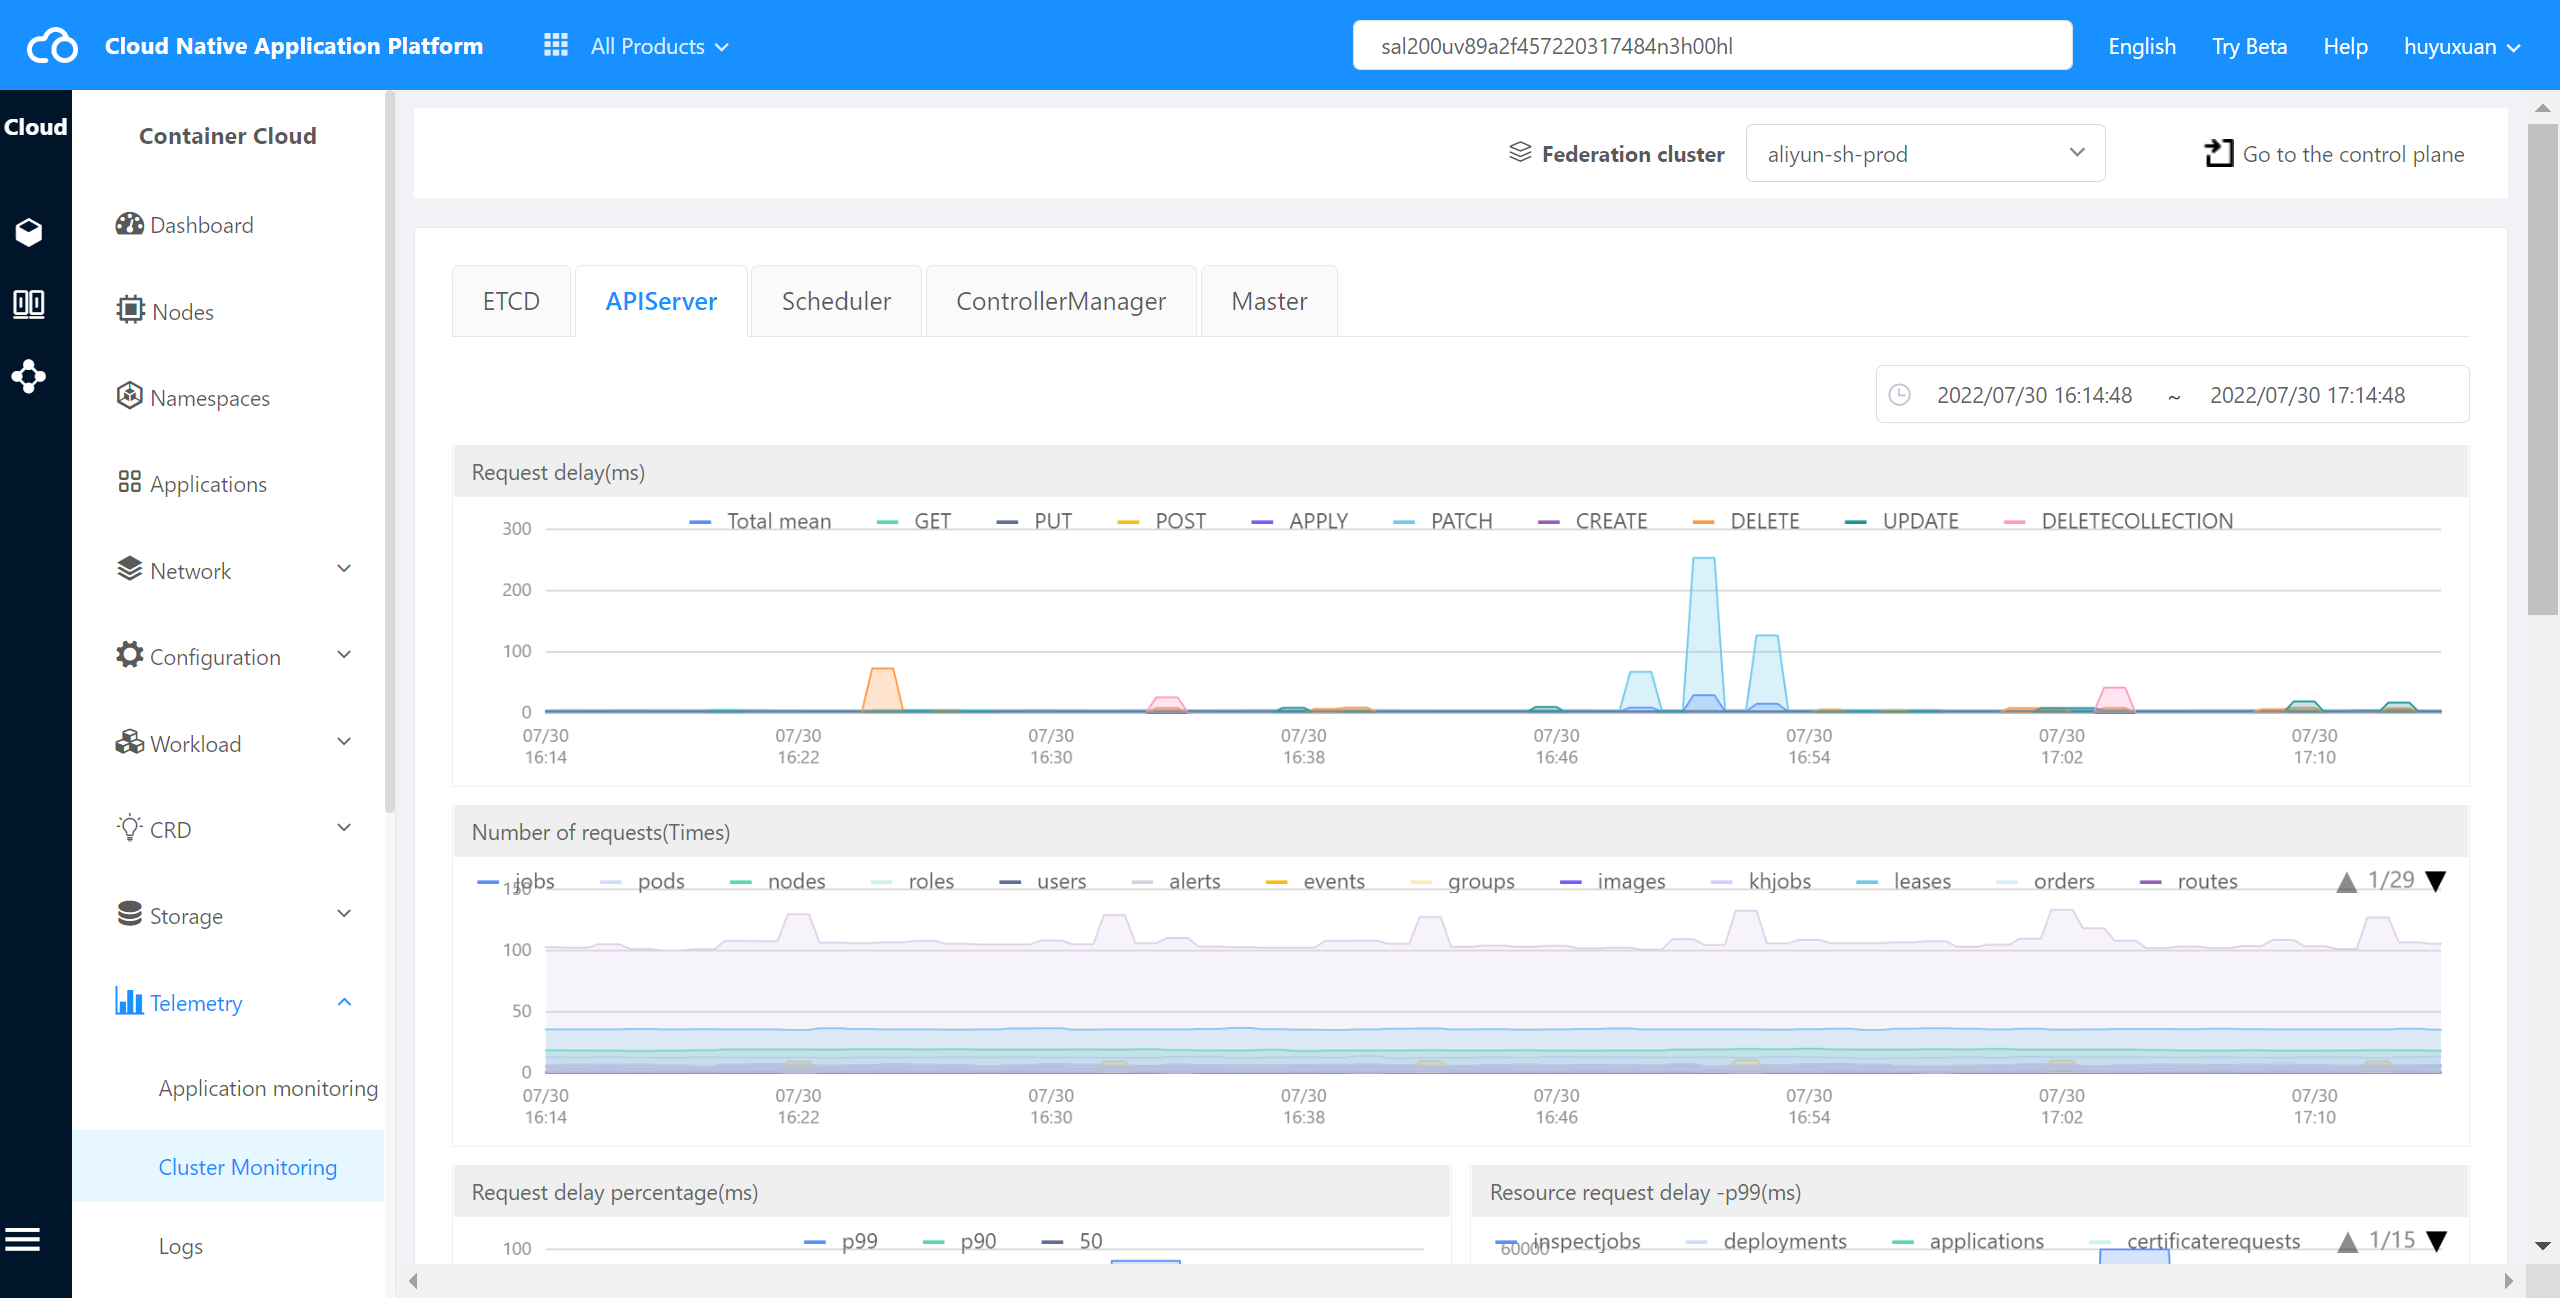
APIServer monitoring indicators include: request delay, requests per second.
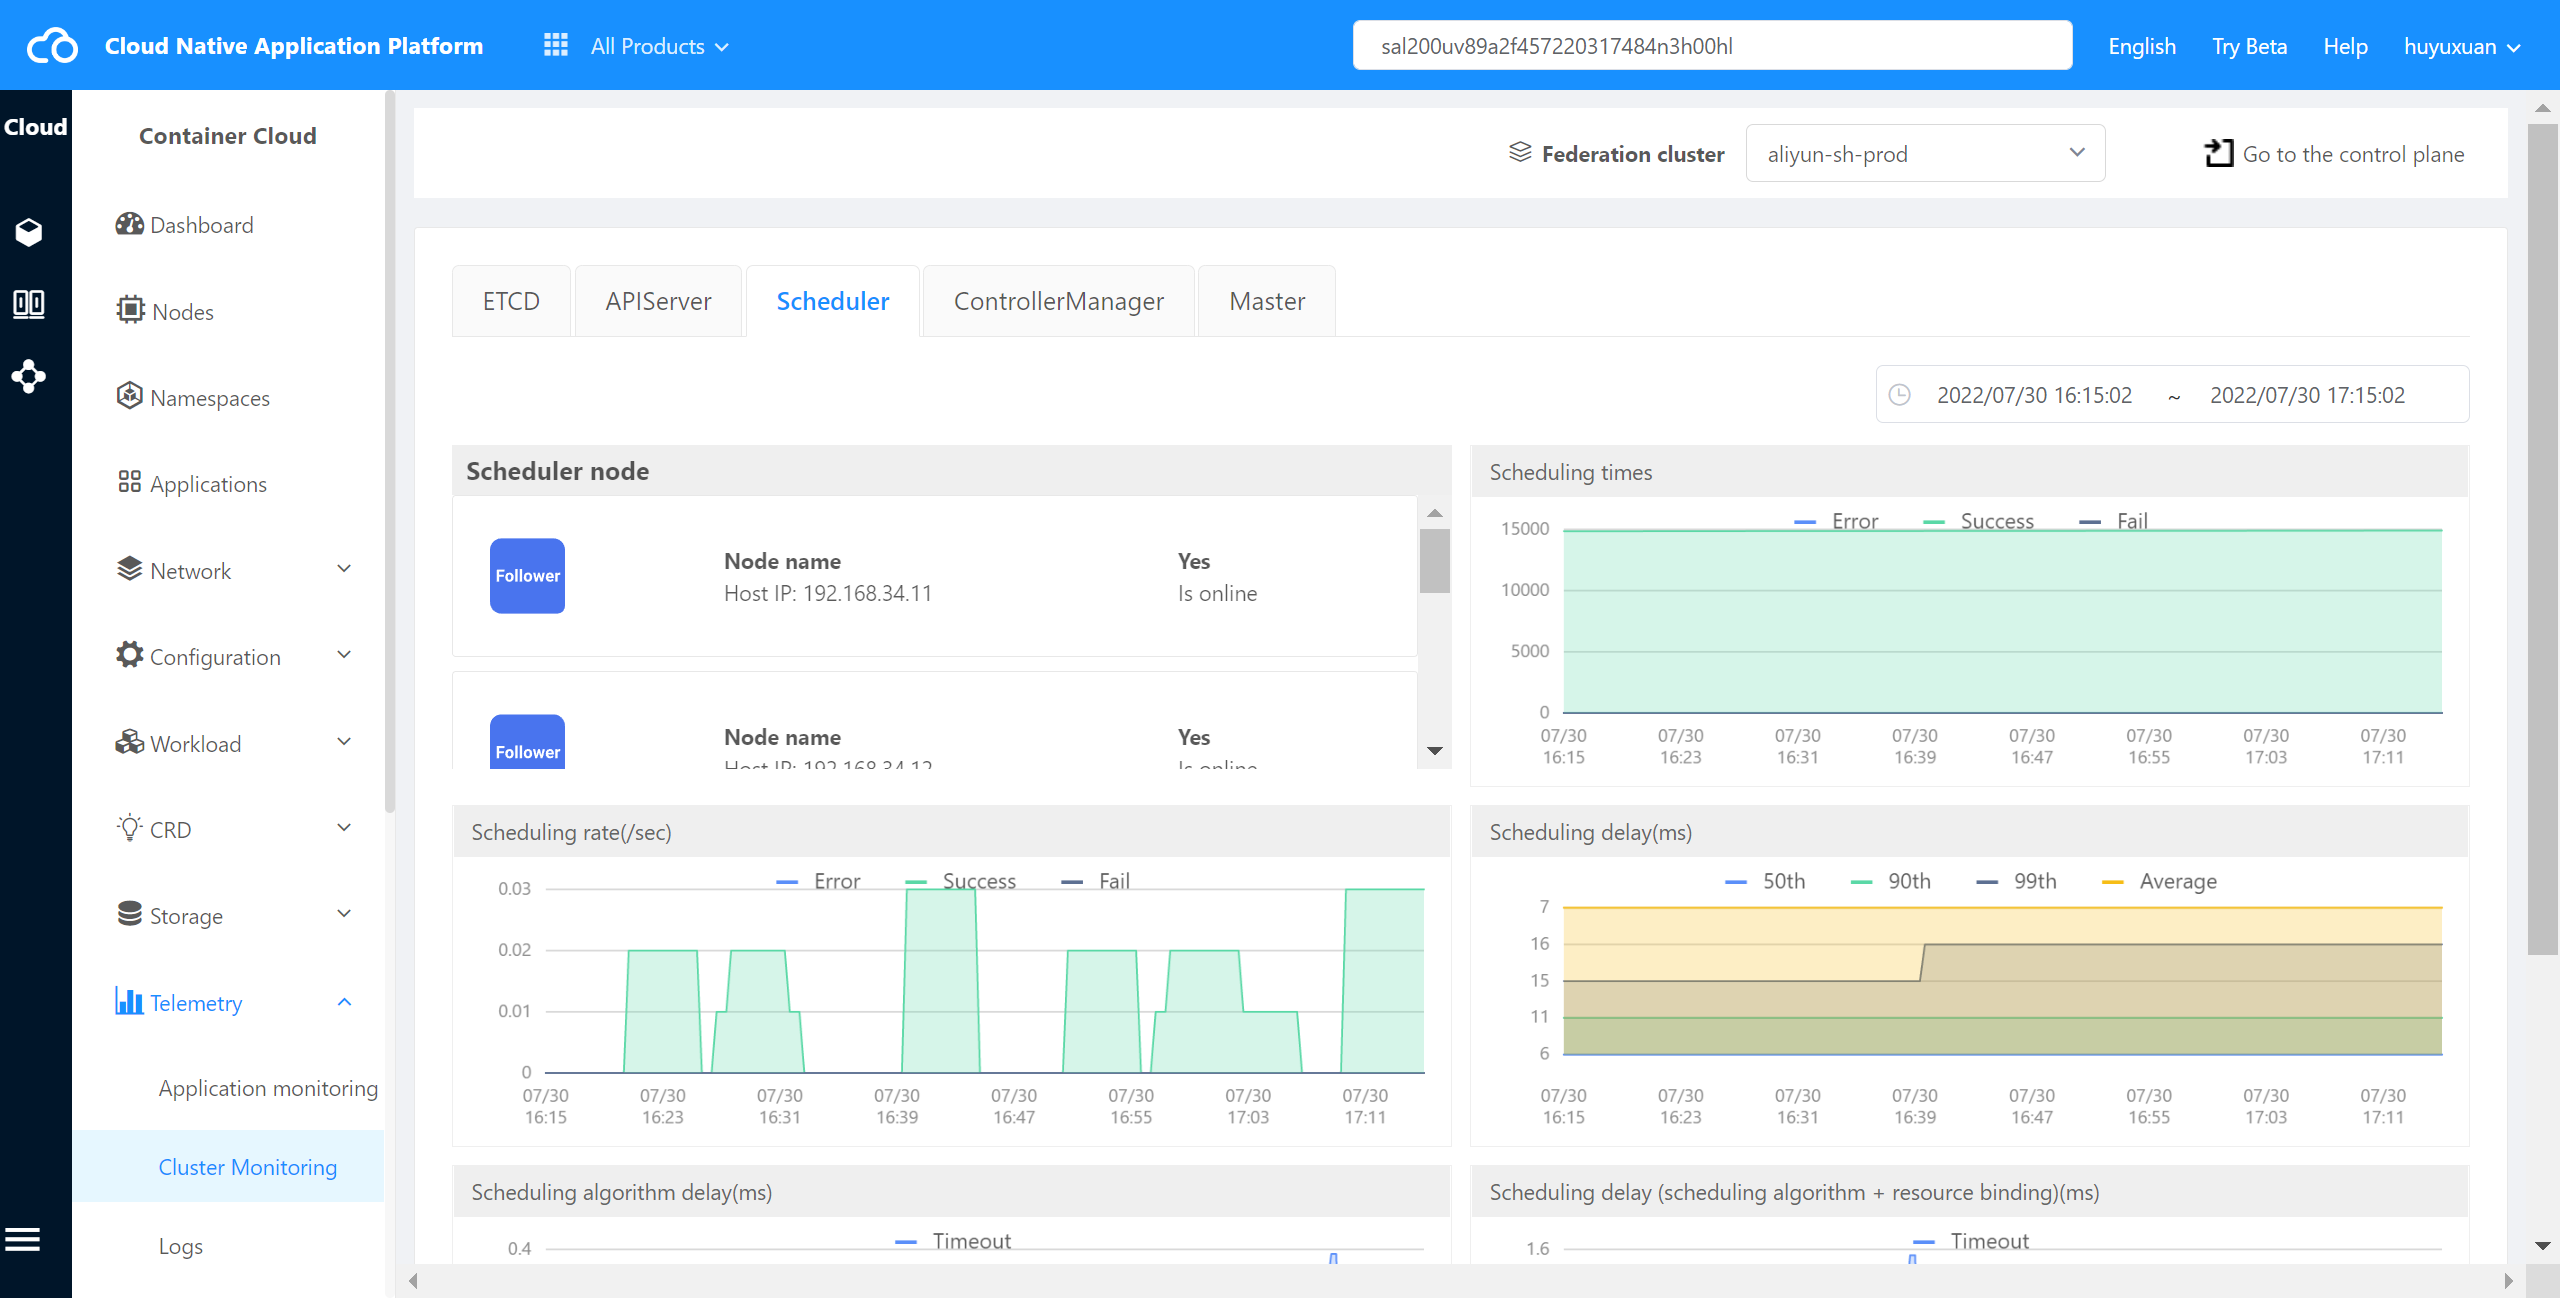
Scheduler monitoring indicators include: scheduling times, scheduling rate and scheduling delay.
Master monitoring indicators include: cpu usage, cpu average load, memory usage, disk usage, inode usage, disk throughput, IOPS, network bandwidth, and container group running status.